Example report part 4: adjusted, simulated FRR – abnormal items
In this excerpt from the Financial Risk Report, the abnormal items of Muster AG are examined and put into context. The BAMAC GROUP’s Financial Risk Report is the tried and tested tool for a comprehensive assessment of your suppliers.
Sometimes something comes up
Of course, managing a company is an activity that is determined by plans, key figures and targets. However, companies do not exist in a vacuum, but in the real world, and occasionally something comes up. That’s life. These unforeseeable events, which have an impact on the company’s activities and finances, appear as abnormal items in the balance sheet. In this excerpt from the Financial Risk Report, the abnormal items of Muster AG are examined and put into context.
The Financial Risk Report
In order to minimize the risks arising from these imponderables, BAMAC Group has developed the Financial Risk Report. The Financial Risk Report is the tried and tested tool for a comprehensive assessment of your suppliers. In our blog, we have already explained the advantages for companies if the default risks of suppliers are known.
The current valuation of Muster AG is influenced by abnormal items insofar as these are listed several times in the balance sheets of recent years. Why these items in the balance sheet must be taken into account in a comprehensive supplier evaluation is explained below. The key figures of Muster AG will then be discussed in more detail.
Definition of abnormal items
Abnormal items in a balance sheet are understood to be unusual or extraordinary items that appear in a company’s financial records. These items are not part of regular operating activities and can therefore distort the impression of a company’s financial condition. They can have both a positive and a negative impact on the balance sheet.
Examples for abnormal items are:
- One-off, extraordinary events such as costs for restructuring measures, profits and losses from the sale of assets are considered abnormal items, as are the discontinuation or modification of business areas. However, the effects of natural disasters and similar events can also appear as abnormal items in the balance sheet.
- Legal or regulatory penalties: If fines or lawsuits result in unusual costs, these can be recognized as abnormal items in the balance sheet.
- Unexpected profits: It can happen that companies make unexpectedly large profits from unforeseen sources. These must also be entered as abnormal items in the balance sheet.
Clearly identifying abnormal items in the balance sheet is important for anyone who wants to get an accurate picture of the company’s financial performance and long-term profitability. In practice, it is therefore not uncommon for companies to prepare separate reports for abnormal items in order to separate them from normal business activities. As a result, investors, analysts and other interested parties can more quickly recognize the financial health of the company and how the abnormal items affect or have affected it.
Effect of the abnormal items of Muster AG
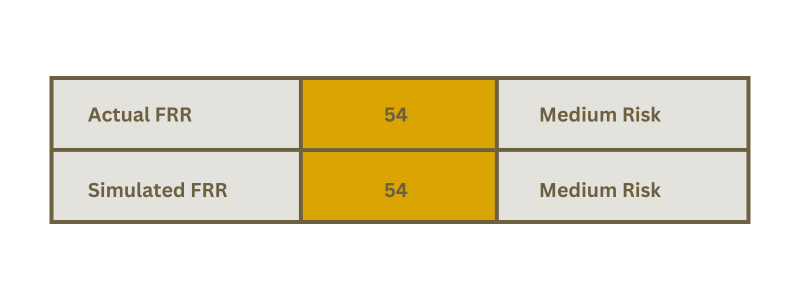
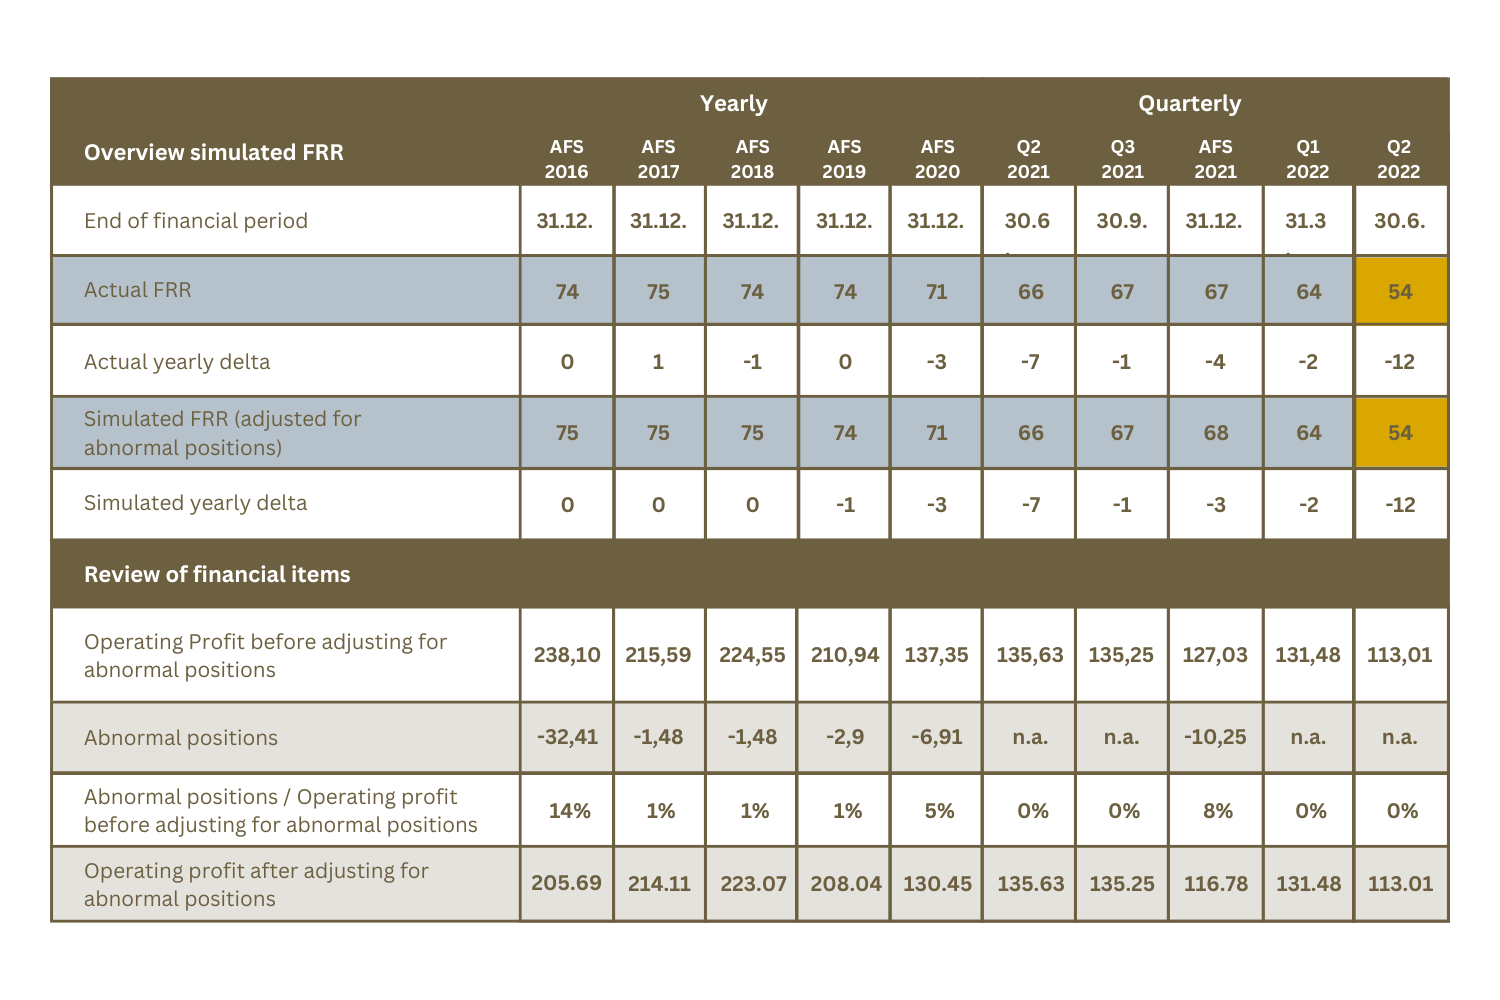
In our sample company evaluation, a decrease of 12 points was recorded compared to the previous year. A comparison with the officially published result also showed a decrease of 12 points. So both our simulation and the officially published data have come to the same conclusion: the company valuation has fallen by 12 points compared to the previous year. Both approaches resulted in a financial risk rating in the middle range of 54 points.
As the table below shows, Muster AG is not exposed to any abnormal items in the period under review. The table also shows that their occurrence is not uncommon for Muster AG. They will be included in the balance sheets in 2016 – 2020 and in 2021. This proves that the occurrence of these one-off items and their effects should be included in the supplier evaluation. Please note that the simulation presented does not address the tax implications if abnormal items are not taken into account.
Final words on abnormal items
While it may be tempting to disregard the actual valuation in favour of the simulated valuation, this should only be done with the potential cost in mind if the abnormal item proves to be symptomatic of larger problems within the organization.
An isolated negative abnormal event can be a temporary setback and should therefore be put into perspective with regard to the relationship with the company. It is common for companies to occasionally report unusual events. Abnormal items can generally be found under operating expenses as other profits/fees in the company balance sheet. As mentioned above, they include one-off items such as goodwill amortization, restructuring costs, one-off legal fees and expenses in connection with natural disasters. The decisive factor in assessing the financial health of the company is the management’s reaction, especially in the event of a loss. A closer examination is therefore advisable.
Our blog series for the Financial Risk Report continues with Part 5 and the cash flow analysis of Muster AG. You can find all the other blog posts further below.
Categories of this post
Further interesting posts.


About the author
