Sample report part 6: FRR liquidity analysis

In a nutshell

This excerpt from the Financial Risk Report looks at the liquidity situation of Muster AG and puts it into context. The BAMAC GROUP’s Financial Risk Report is the tried and tested tool for a comprehensive assessment of your suppliers.

Liquidity analysis in the Financial Risk Report

Within the Financial Risk Report, BAMAC Group carries out numerous investigations in order to guarantee a comprehensive supplier evaluation. In this excerpt from the Financial Risk Report, we present the liquidity analysis of Muster AG.

Liquidity situation of Muster AG

The liquidity analysis of Muster AG has shown that this is satisfactory in view of the measured average company substance. It should be noted that both the company’s working capital and cash liquidity have fallen. The figure illustrates this development.

Tabular representation of the liquidity ratio of Muster AG for the years 2020 to 2022, in the form of a line chart. The X-axis shows the data up to 2.5 in 0.5 increments. The Y-axis shows the years 2020, 2021 and 2022 up to the second quarter. The lines illustrate the development of collection liquidity and cash liquidity.
Liquidity ratio of Muster AG for the years 2020 to 2022

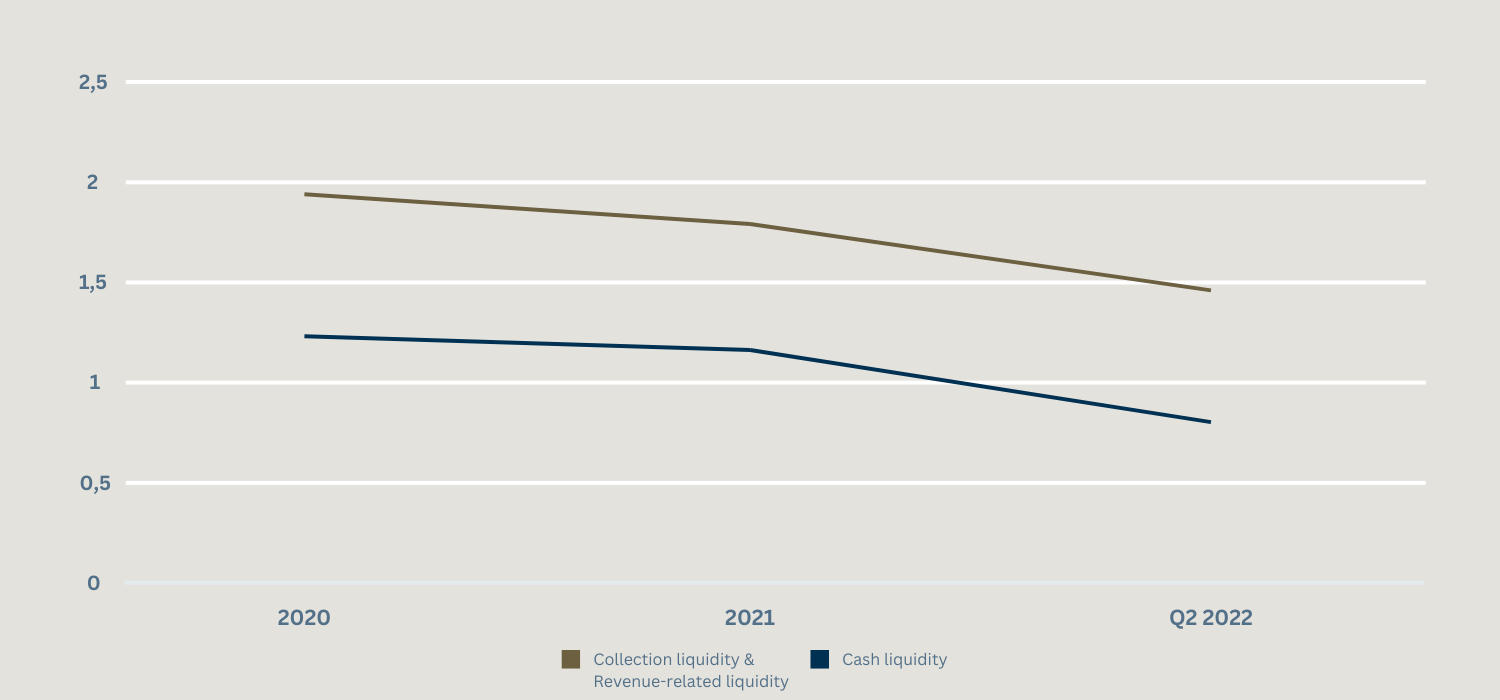
Specifically, the liquidity analysis shows that Muster AG has a cash liquidity of 0.78. This means that EUR 0.78 in cash is offset by EUR 1.00 in current liabilities. This means that the company has a high level of cash liquidity in relation to its current liabilities. This ratio is often referred to as the “liquidity ratio” or “cash-to-short-term liabilities ratio”.

In this case, a liquidity ratio of 0.78 means that Muster AG is able to settle almost 78% of its current liabilities from existing cash and cash equivalents. This is an appropriate level of liquidity and can be regarded as solid. It indicates that the company is in a position to meet its short-term financial obligations without running into liquidity bottlenecks.

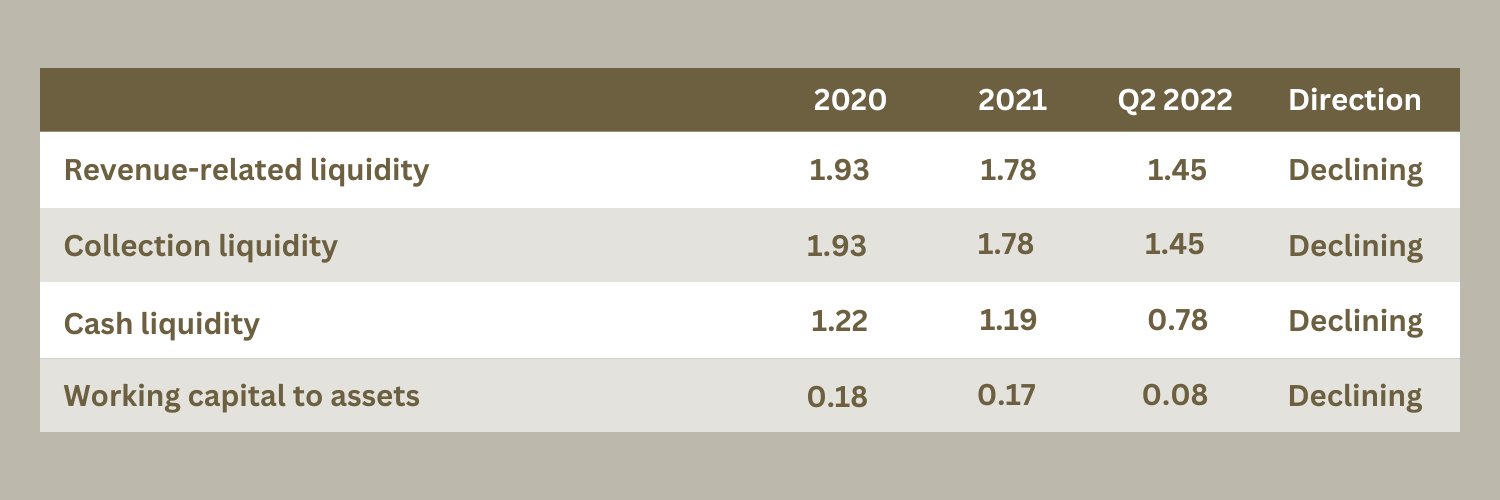
A high liquidity ratio of more than 1.0 would mean that the company has more cash than current liabilities, which would indicate a very strong liquidity position. These are the results of liquidity analyses in the past, as shown in the table.

Tabular presentation of the degree of liquidity of Muster AG for the years 2020 to the second quarter of 2022. There are four categories: ‘Sales-related liquidity’, ‘Collection liquidity’, ‘Cash liquidity’ and ‘Working capital to assets’.
Table on the liquidity ratio of Muster AG for the years 2020 to 2022

Reasons for the liquidity analysis

The cash liquidity of a company refers to the amount of cash and cash equivalents available to the company at the time of an analysis. As it reflects its ability to meet short-term obligations, it is an important measure of a company’s financial health. Liquidity analysis is therefore an integral part of BAMAC Group Financial Risk Report.

In the next part of the Financial Risk Report blog series, we will look at and evaluate the key figures for receivables processing and asset utilization at Muster AG. All other blog posts can be found below.

Further interesting postss.

05.03.2024
10 Min.
Sample report part 1: FRR Management Summary
The predictability offered by a secure supply chain is worth its weight in gold. The BAMAC GROUP's Financial Risk Report enables you to obtain this information. In this article, we will use an example report to show you what information and benefits you can gain for your company from the Financial Risk Report.
05.03.2024
6 Min.
Sample report part 2: Historical FRR and analysis of performance categories
We at the BAMAC GROUP help you to assess the financial risk rating of your suppliers as well as their default risk in order to ensure a secure supply chain. In this article, we take a look back and examine the development of the financial risk rating of the Muster AG and analyze the performance categories.
05.03.2024
8 Min.
Example report part 4: adjusted, simulated FRR – abnormal items
In this excerpt from the Financial Risk Report, the abnormal items of Muster AG are examined and put into context. The BAMAC GROUP's Financial Risk Report is the tried and tested tool for a comprehensive assessment of your suppliers.
05.03.2024
6 Min.
Sample report part 3: FRR analysis of the company substance
BAMAC Group's Financial Risk Report is the proven tool for supplier evaluation. To give you a precise idea of the report and its benefits, we present it in detail here. This article takes a closer look at Muster AG: Current areas of strength and weakness compared to past performance are highlighted.
05.03.2024
6 Min.
Sample report part 5: FRR cash flow analysis
Within the Financial Risk Report, BAMAC Group carries out numerous investigations in order to guarantee a comprehensive supplier evaluation. In this article, we present the results of the cash flow analysis of Muster AG.
05.03.2024
8 Min.
Sample report part 9: The balance sheet from the perspective of the FRR
In this concluding article on the Financial Risk Report, we present the balance sheet and income statement of Muster AG and explain why a look at these financial documents also makes sense for supplier evaluation.
05.03.2024
5 Min.
Sample report part 8: ROA analysis according to DuPont in the FRR
In this excerpt from the Financial Risk Report, we examine the return on assets (ROA) of Muster AG using the DuPont analysis.
05.03.2024
5 Min.
Sample report part 7: Activity relationships in the FRR
This article is dedicated to the section of the Financial Risk Report that examines the activities of Muster AG. We take a look at the key figures for receivables processing and asset utilization and show findings result from this analysis.
05.03.2024
5 Min.
Supplier evaluation with the Financial Risk Report: Secure your supply chain
A secure supply chain is worth its weight in gold, as it ensures your company's long-term success. The Financial Risk Report is our tried and tested tool that makes supplier evaluation much easier for you.