Case Study: Make or Buy – The first glance can be deceptive!
Case Study: Make or Buy? This article explains what should be considered when deciding on an IT system.
Make or buy – this should be taken into account when deciding on an IT system
From an economic point of view, there is no simple answer to the question of whether a system should be developed in-house or provided as standard software (make or buy). The blanket statement that standard software is the more economical solution is just as wrong as, conversely, that in-house development is the ideal solution. In order to approach a transparent evaluation, it has been shown that a particular cost consideration is not sufficient. This is because comparing development costs and license costs or customizing costs creates a deceptive picture. Nor is it sufficient to compare maintenance costs, as in the worst case these are determined by the product manufacturer’s marketing department. But even if the decision is made to develop in-house, this can quickly become a cost driver.
Our experience shows that only a comparison of life-cycle costs enables a transparent cost comparison of make (in-house development) and buy (purchased solution) solutions.
The following case study examines the question of which solution is more favorable and also shows options for decision-making.
Your goals are important – what should the IT system be able to do?
Your objectives are essential for making a make or buy decision. What is important to you? Time to Market? The most cost-effective solution? How close is it to the standard? These and other goals are determined at a kick-off meeting. The data is then analyzed.
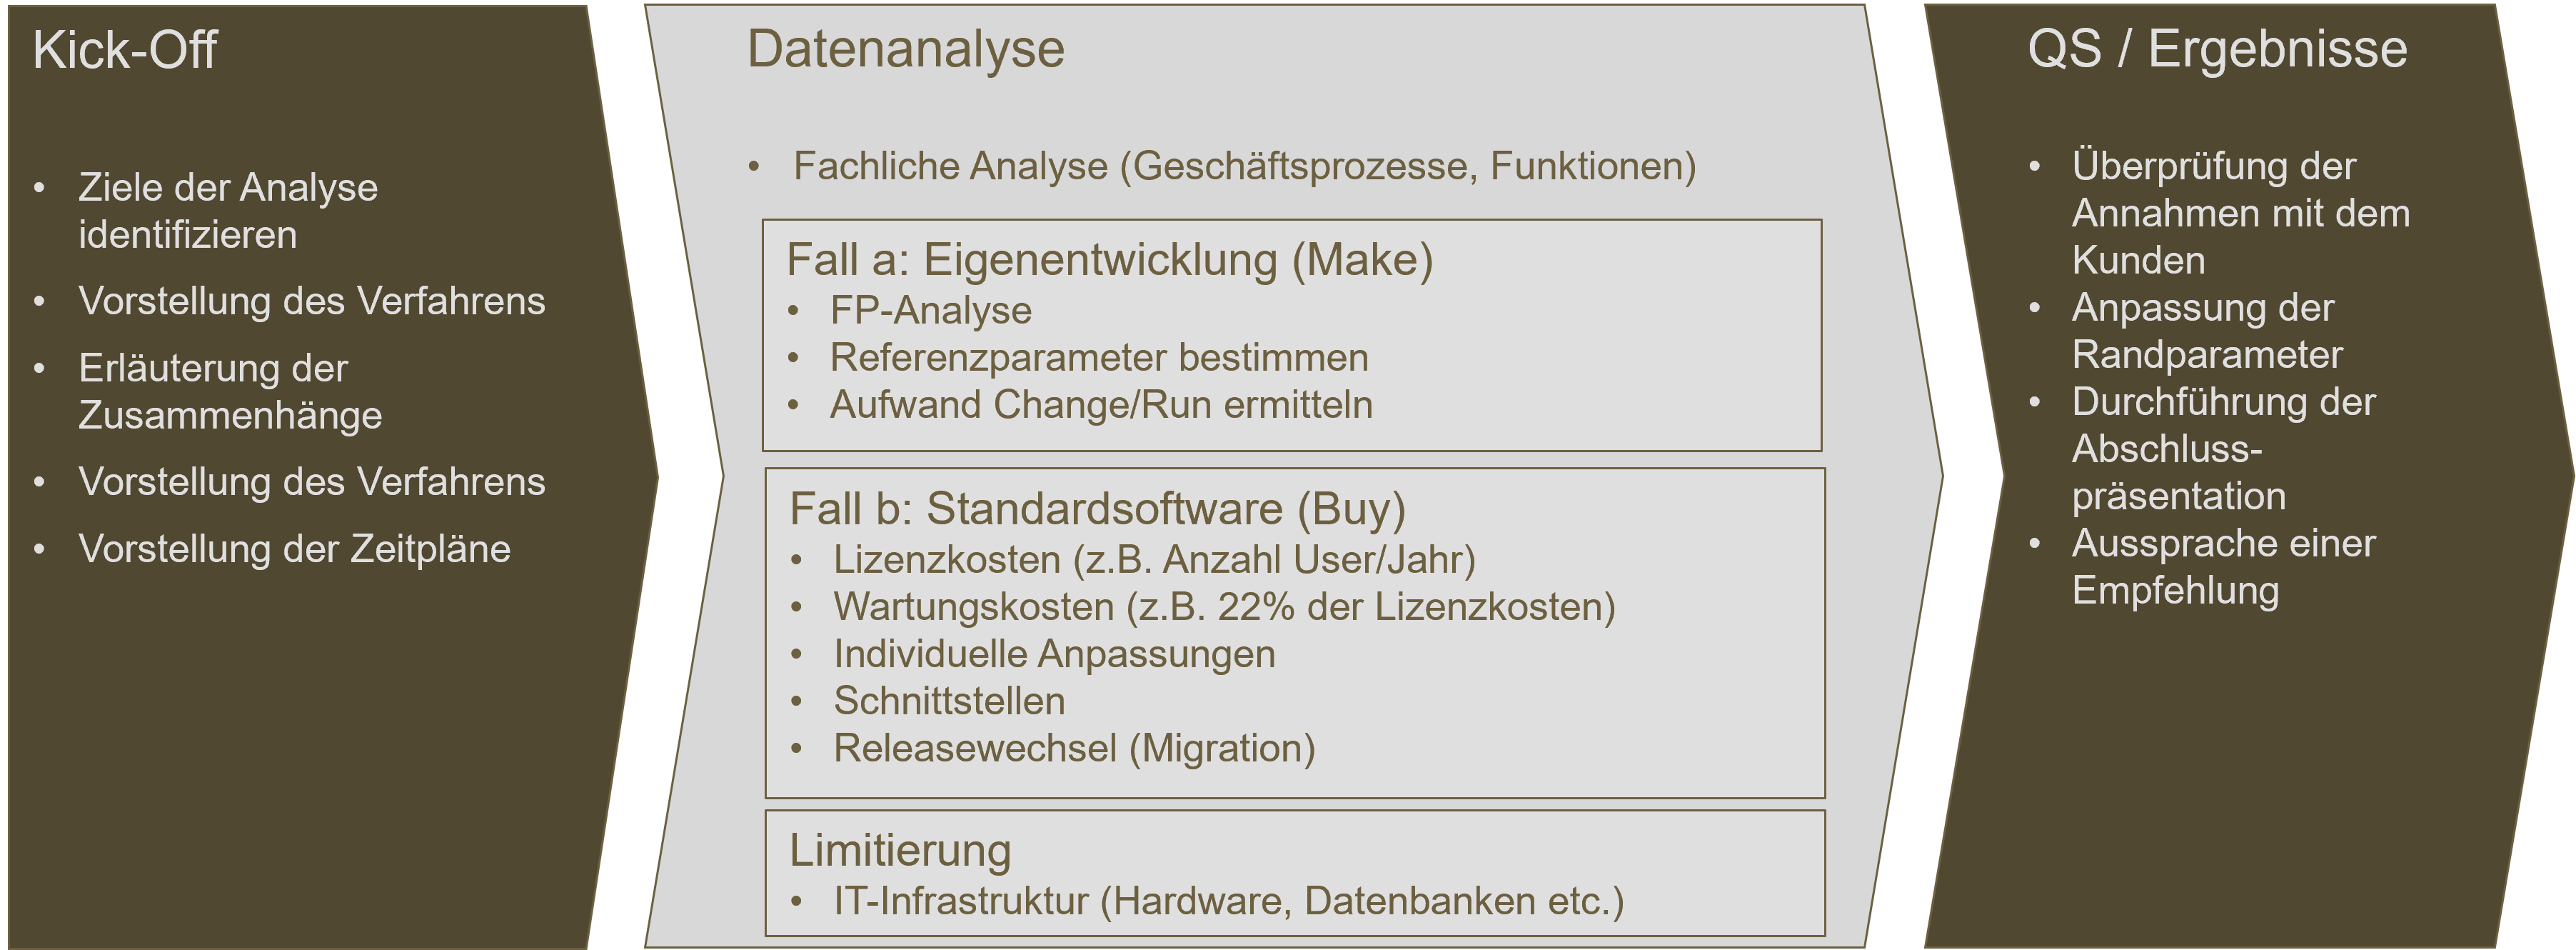
The building blocks of the analysis are put together based on your objectives. For the in-house development solution (Make), the range of functions is first examined in order to then define productivity for Change and Run. Based on this, the costs for development and maintenance can be identified.
For the standard solution (Buy), on the other hand, an extended procedure is selected. First, the components that make up the costs are identified. These include:
- License costs: The calculation of license costs is not a standardized procedure, but is designed very individually by the product manufacturers. This example assumes a volume-based approach that is payable annually.
- Maintenance costs: The maintenance costs also follow very individual concepts of the product manufacturers. This example is based on a standard market share that can be derived from the license costs as a percentage.
- Individual customizations: The individual customizations take into account your wishes in which the process or functionality differs from the standard provided. The degree of individualization varies. A high degree of customization is common practice in many cases.
- Interfaces: In order to integrate the standard software into the system landscape, interface adaptations are often necessary. This is done initially and must be repeated for release changes.
- Release change (migration): Release upgrades are also a feature of standard software. Due to the manufacturer’s product policy, such release changes are temporarily necessary. They include activities such as data migration, adaptation of interfaces and implementation of individual customizations that have already been provided in previous releases.
Make or buy – a practical example:
The procedure described above is now illustrated in an example from our practice. In this case, the following requirements for the IT application are already known in advance:
- The identified functional scope of the application is 2500 function points.
- The development time (change) or customizing is 1 year.
- The planned operating time is 10 years.
The costs for both in-house development (make) and standard software (buy) are then determined.
Case a: In-house development (Make)
The first step is to determine the development costs (Change) for in-house development (Make). After analyzing the organizational boundary conditions, the following productivity indicators are assumed:
- The productivity for the development speed PK1 [FP/PM] is 11.88 FP/PM
- The productivity for the development period and expenditure PK2 [EUR/FP] is EUR 2,825/FP.
This results in the following development costs (change) for the project:
- Costs (change): EUR 7,062,500 (1)
- Development time: 210.4 PM
- Resources (FTE): 17.5
The expenses for maintenance (run) are then calculated. For this purpose, organization-specific values could be used for productivity PK2 (Run) (alternatively, the BAMAC GROUP provides the data via its database). As a result, the costs for maintenance per year are as follows (see Table 1):
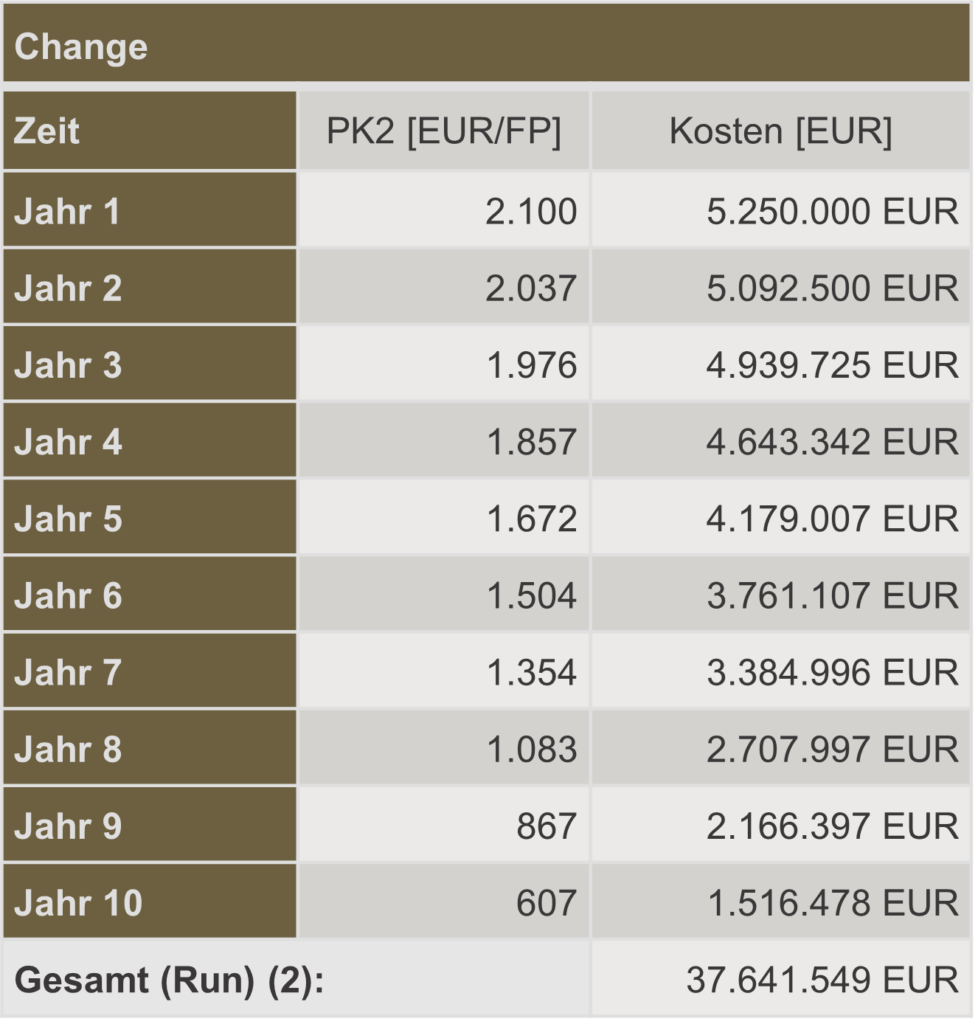
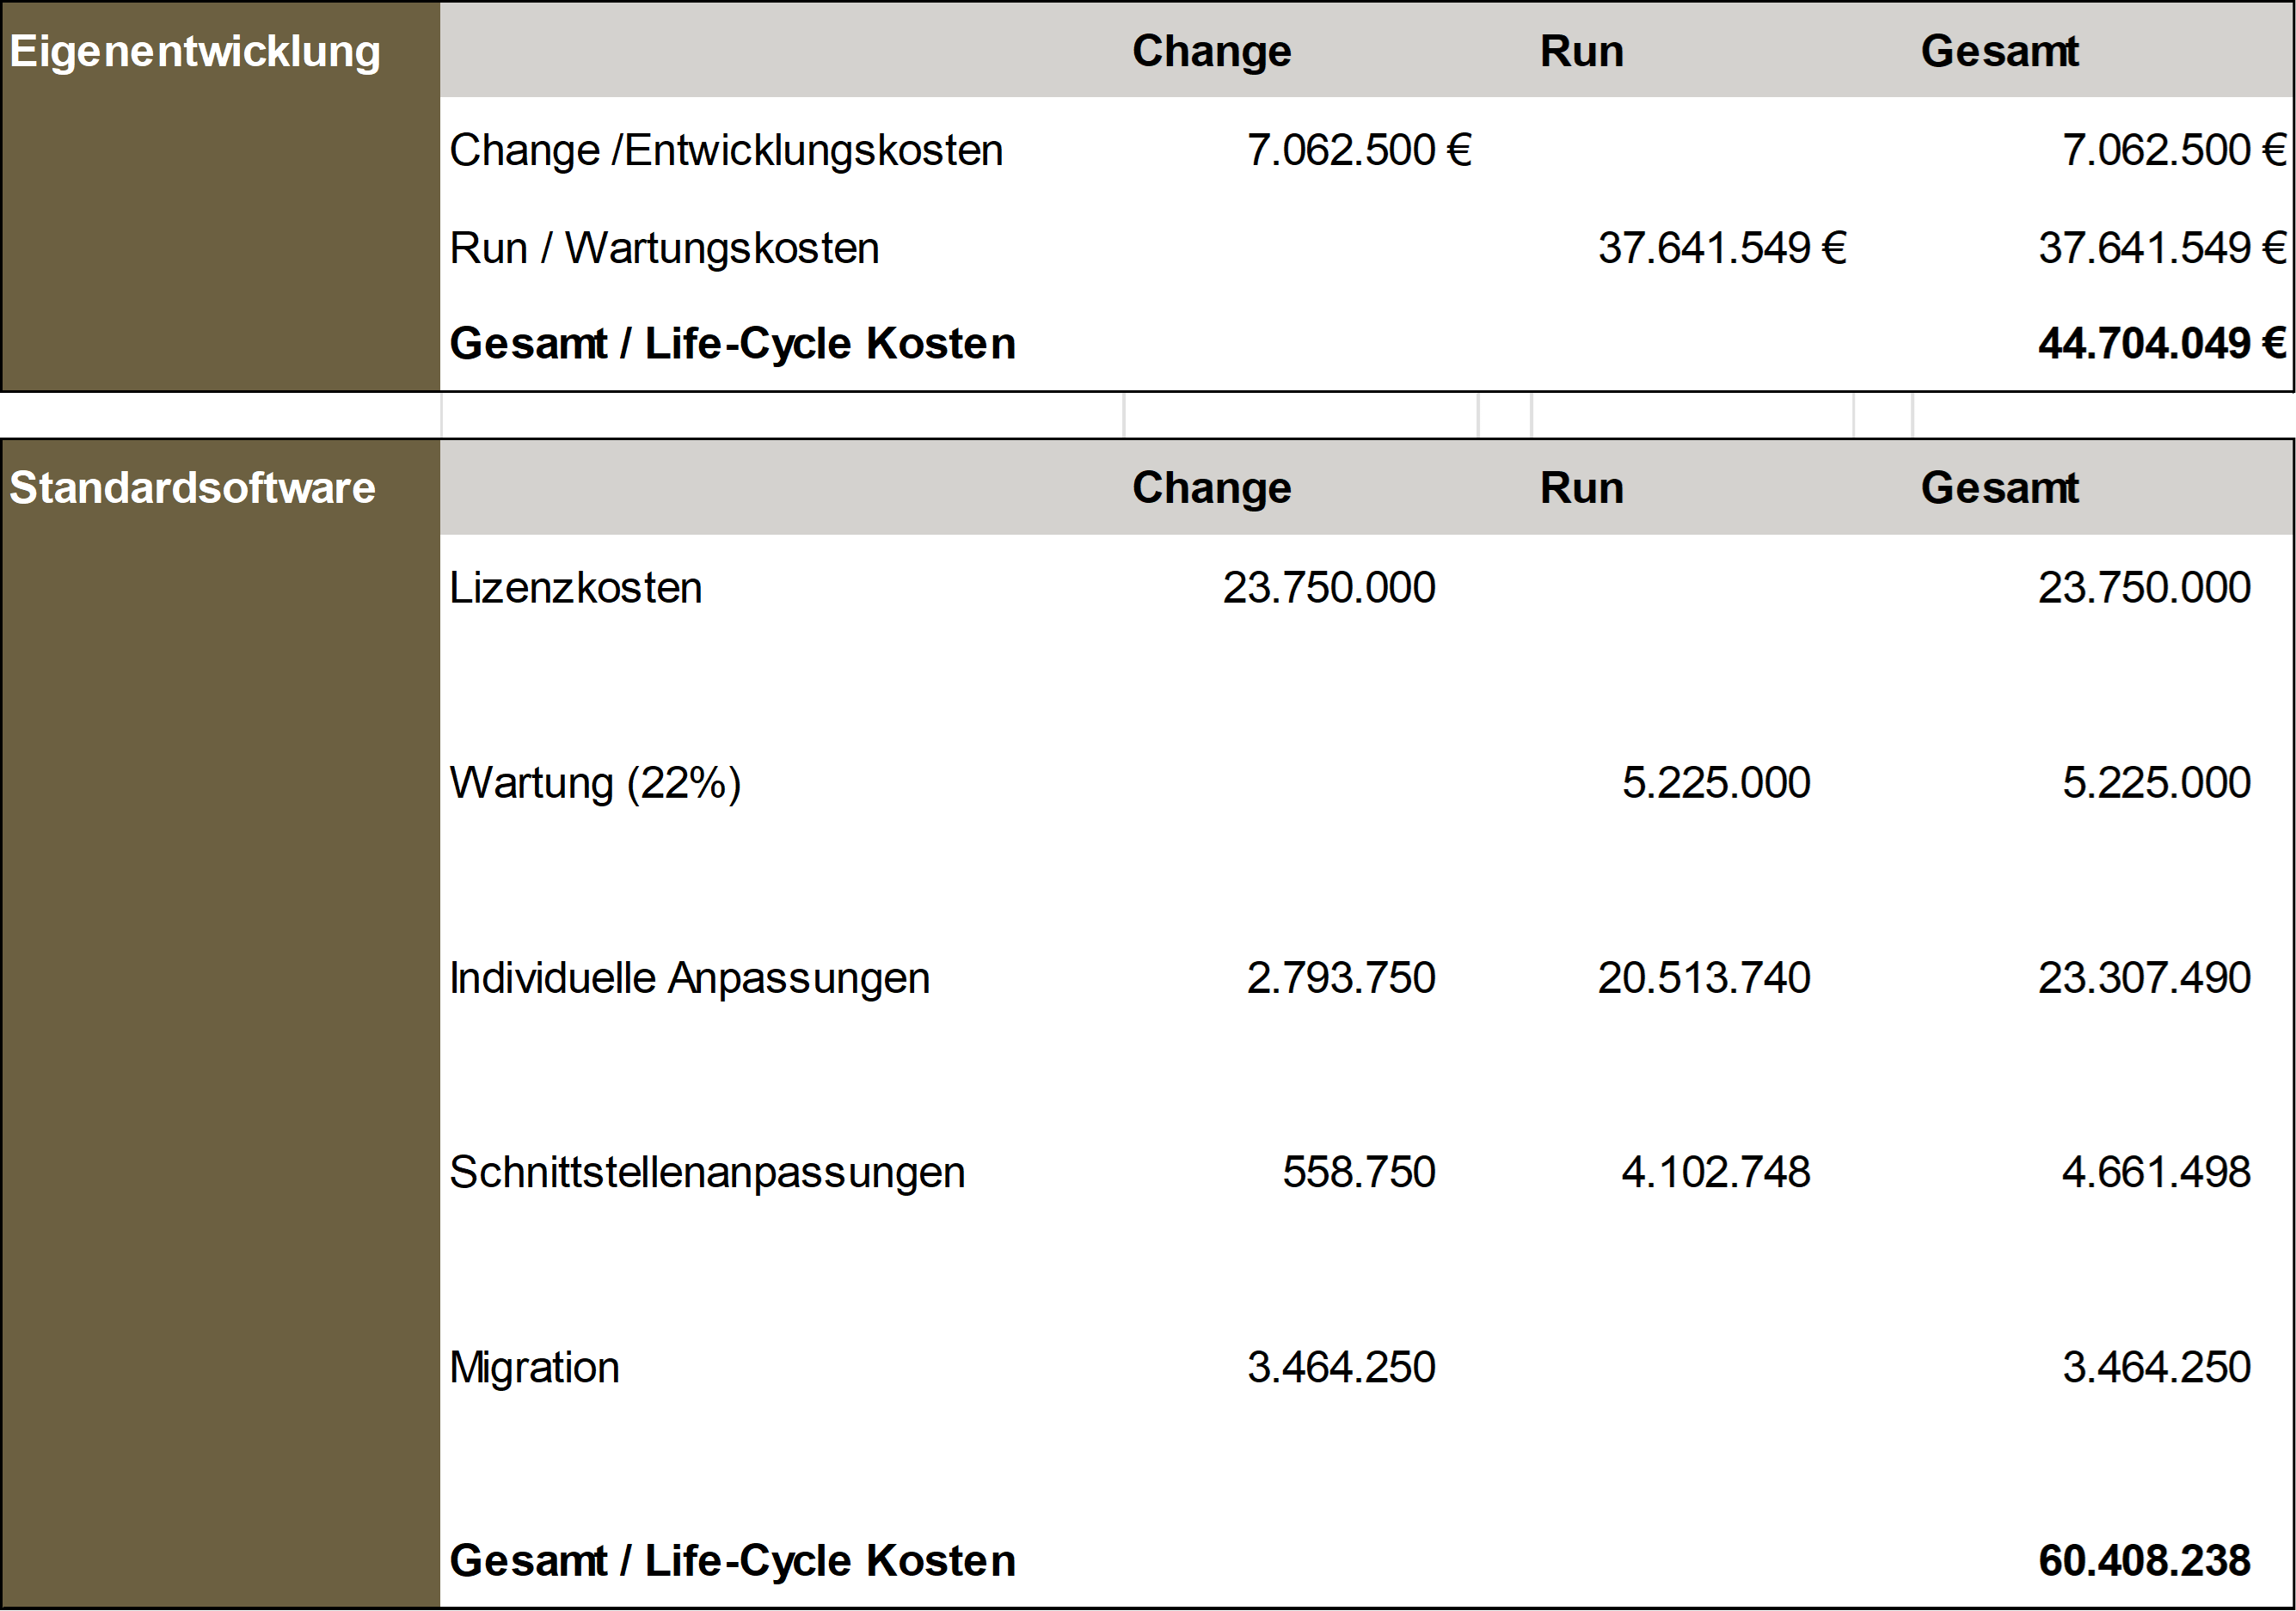
The total for Change (1) and Run (2) results in life cycle costs for in-house development (Make) of EUR 44,704,049.
The following is a sample calculation for the option of standard software (buy).
Case b: Standard software (Buy)
The five steps listed above are used to determine the life cycle costs for the buy solution . The following boundary conditions are assumed:
- License costs: The costs per license and year are EUR 4,750 for 500 users.
- Maintenance costs: The maintenance costs are calculated from the annual license costs and account for 22% of the license costs.
- Individual customizations: In our example, we assume that 30% of the functionalities are customized. Conventional programming work is required here, the effects of which are similar to those of in-house development.
- Interface adaptations: We assume 10 interfaces to be adapted, which are required for integration into our customer’s system landscape.
- Release change: Due to a release change on the part of the manufacturer, the customer plans a release change during the operating period. The release upgrade includes data migration, interface adaptations and the migration of individual customizations, which in this case must be provided again.
For a better understanding, the individual steps up to the determination of the total costs are shown below.
Step 1: License costs
The present license model provides for a flat fee per user and year. The cost per user/per year is EUR 4,750. The number of users is 500.
This results in license costs of EUR 2,375,000 per year. For the year of development, it was agreed with the manufacturer that no license costs would be incurred.
Operating costs of EUR 23,750,000 (3) are therefore incurred for the operating period.
Step 2: Maintenance costs
The maintenance costs are estimated at 22% of the license costs. Overall, maintenance includes both consulting and support for application operation, as well as analyses to improve business processes.
The costs per year therefore amount to EUR 522,500. This results in total expenses of EUR 5,225,000 for the 10-year operating period (4).
Step 3: Individual adjustments
Since the customer is only partially satisfied with the standard specifications, 30% of the functionality is to be adapted according to his wishes. This means that 750 FPs of the functions are affected. The classic approach to calculating costs is based on development and maintenance.
The following customer-specific productivity factors are assumed:
- The development speed PK1 [FP/PM] is 13.5 FP/PM
- The development costs or development expenses for PK2 [EUR/FP] amount to EUR 3,725/FP.
This results in development costs (change) of EUR 2,793,750 (5).
The development time is 55.6 PM. The number of resources required is 4.6 FTEs.
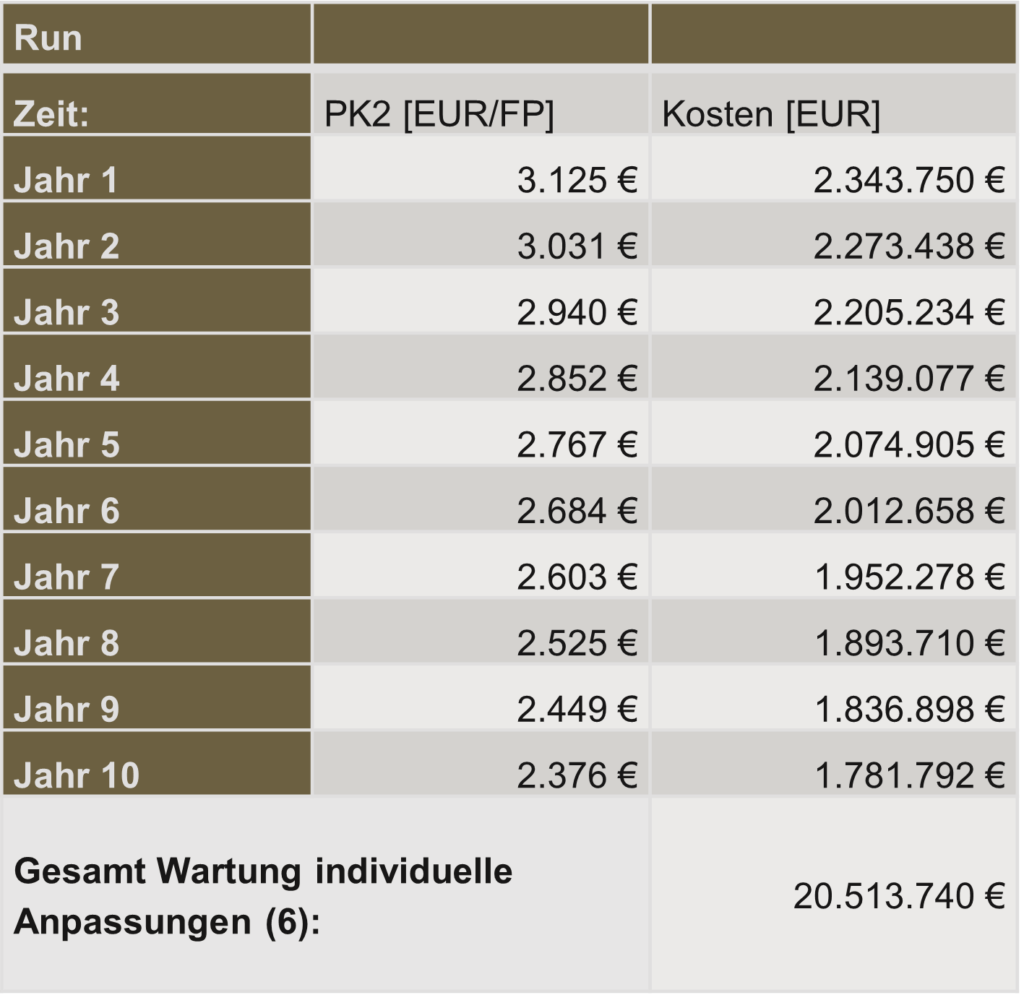
The maintenance costs (run) are based on the organization’s baseline data for PK2 (see Table 2). This results in maintenance costs of EUR 20,513,740 (6).
Step 4: Interface adjustments
As already mentioned, an adjustment of 10 interfaces has been assumed. The determined function points amount to 150 FPs. The associated development and maintenance expenses are as follows:
- Productivity is 13.5 FP/PM as above for the development speed
- Productivity for development costs amounts to EUR 3,725/FP.
This resulted in development costs of EUR 558,750 (7).
The development time is 11.1 PM and the required resources are 0.9 FTEs.
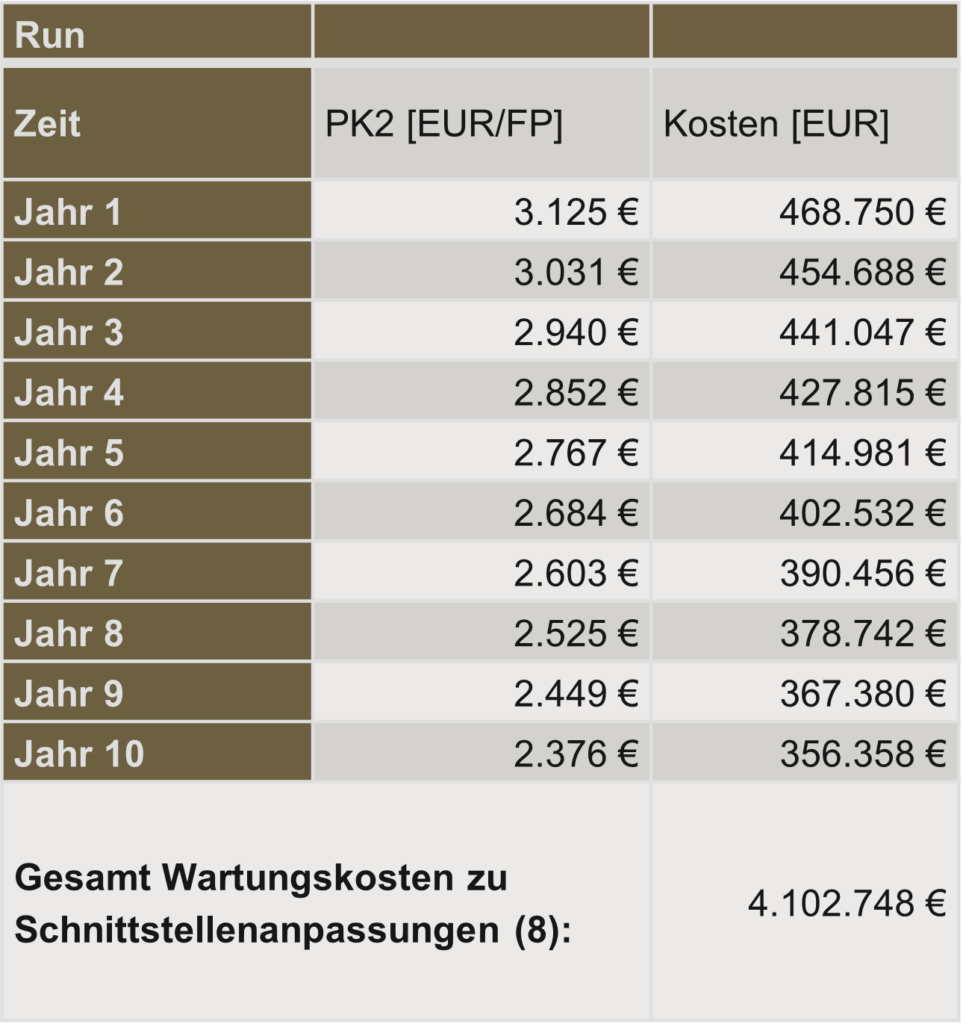
In addition, taking into account productivity PK2 (see Table 3), maintenance expenses of EUR 4,102,748 (8) were calculated. The same productivity is assumed as for the individual adjustments.
Step 5: Release change
In the end, it was assumed that a release change would have to be managed during the operating period. No new functions will be introduced, but the previously provided functions will continue to be made available. The following activities must be taken into account for the migration:
- Data migration
- Interface adaptations and
- Individual customizations
The measured range of functions is 930 FPs.
Here, too, the procedure is the same as for in-house development. First, the development costs (change) are recorded. In the case of maintenance costs, the costs already listed above are assumed, as the analysis did not reveal any significant deviations.
The following productivity is assumed:
- Development speed 13.5 FP/PM
- Development costs EUR 3,725/FP
The resulting development costs for the release change amounted to EUR 3,464,250 (8).
The development time is 68.9 PM and the required resources 5.7 FTE. The maintenance costs are not applicable, as we have already taken them into account above.
Summary Make or Buy
In summary, the costs for in-house development over the life cycle amount to approximately EUR 44.7 million.
The cost of introducing the standard software, on the other hand, amounted to EUR 60.4 million.
At 35%, the life cycle costs of standard software are therefore significantly higher than those of in-house development. To reduce the costs of the standard solution, fewer individual adjustments could be permitted or migration could be dispensed with. In practice, it is regularly found that the proportion of individual adjustments is often significantly higher than 30% (e.g. banks and insurance companies 50%). As a result, the standard solution (Buy) would perform even worse than the in-house development (Make) as listed below.
The advantages of the standard solution include the shorter implementation period and the resources required. The implementation time for standard software is considerably faster and requires fewer resources. In addition, it must be checked whether the calculated release change is actually necessary. Dispensing with this would save costs.
Make or buy – your decision
The decision as to which solution is the right one for the company depends on your objectives (e.g. development time vs. costs).
If we summarize all the results of the case study, these key levers for increasing efficiency and freeing up resources for the change area in your IT product portfolio can be identified particularly effectively:
- Remove functionalities that are no longer used.
- Replace legacy systems.
- Standardize processes and functions – do without arabesques.
- Consolidate data and functions.
- Make or buy: Make your decision based on productivity criteria.
- Make or buy: compare life-cycle costs.
You can find another practical example of how to prevent maintenance costs from eating you up in our blog.
Categories of this post
Further interesting posts.


