Sample report part 3: FRR analysis of the company substance

In a nutshell

BAMAC Group’s Financial Risk Report is the proven tool for supplier evaluation. To give you a precise idea of the report and its benefits, we present it in detail here. This article takes a closer look at Muster AG: Current areas of strength and weakness compared to past performance are highlighted.

Analysis of the substance of the company

In this article, we analyze the corporate substance of Muster AG. Current areas with strengths and weaknesses compared to previous performance and other industry players are highlighted. The sector leaders and laggards show the performance of companies in the top and bottom decile of the sector for this performance indicator.

Financial Risk Report Part 3

BAMAC Group’s Financial Risk Report is the proven tool for supplier evaluation. We have already explained the advantages of supplier evaluation for a company’s success in detail before. You can also find an overview of all parts of the Financial Risk Report and their detailed descriptions here.

Analysis of the company substance – strengths of Muster AG

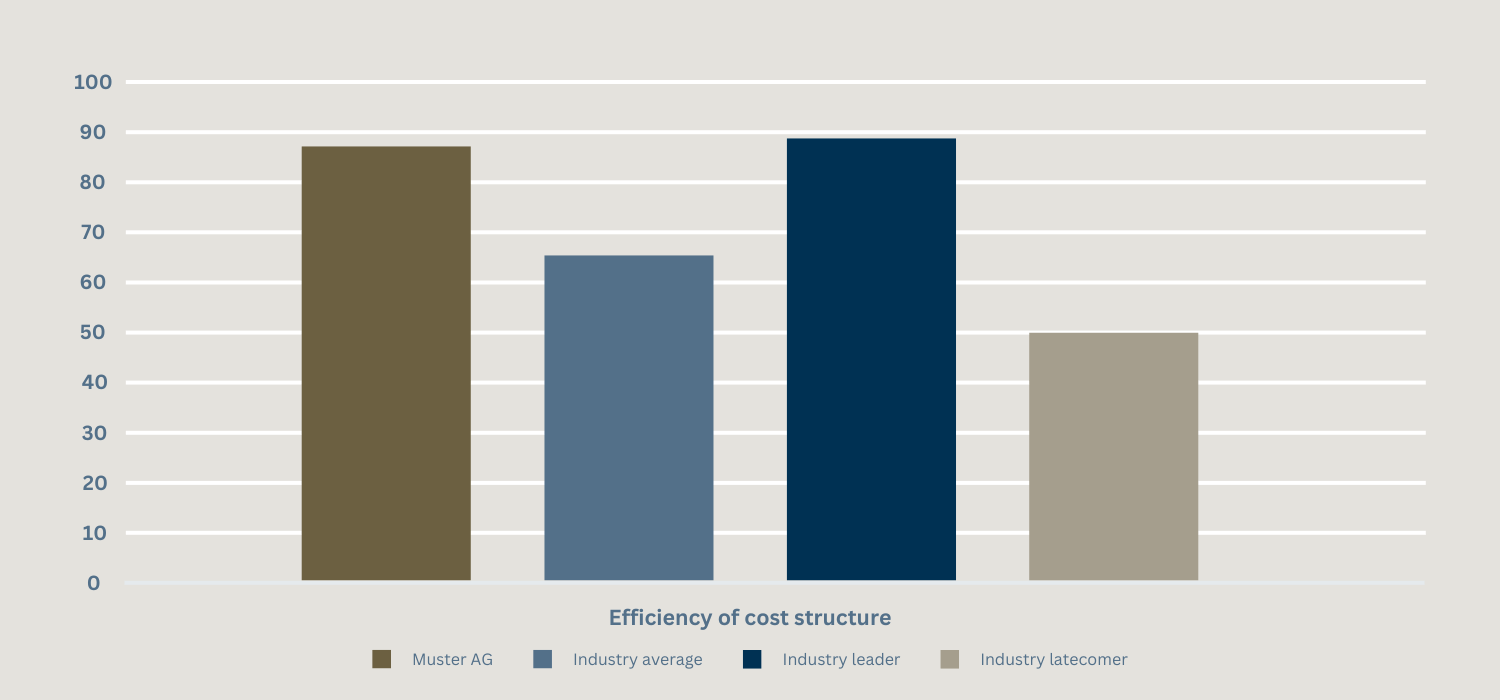
First, we present the strengths of the evaluated company. In the case of Muster AG, it is noticeable that the company’s cost structure is particularly efficient. The overall assessment of the cost structure is based on a series of key figures. Variables such as production costs, personnel costs, other operating expenses, depreciation, interest expenses and corporation tax are taken into account in relation to a base such as total revenue and total expenses. The chart illustrates the very good cost structure of Muster AG compared to the rest of the industry.

Representation of a bar chart, within a coordinate system, on the efficiency of the cost structure of Muster AG compared to the industry.
The efficiency of Muster AG’s cost structure compared with the rest of the industry.

We then highlight the weaknesses of the company being valued. The analysis of the corporate substance of Muster AG revealed that there is potential for improvement both in the efficiency of the capital structure and in the operationalized profitability of Muster AG.

Weaknesses of Muster AG

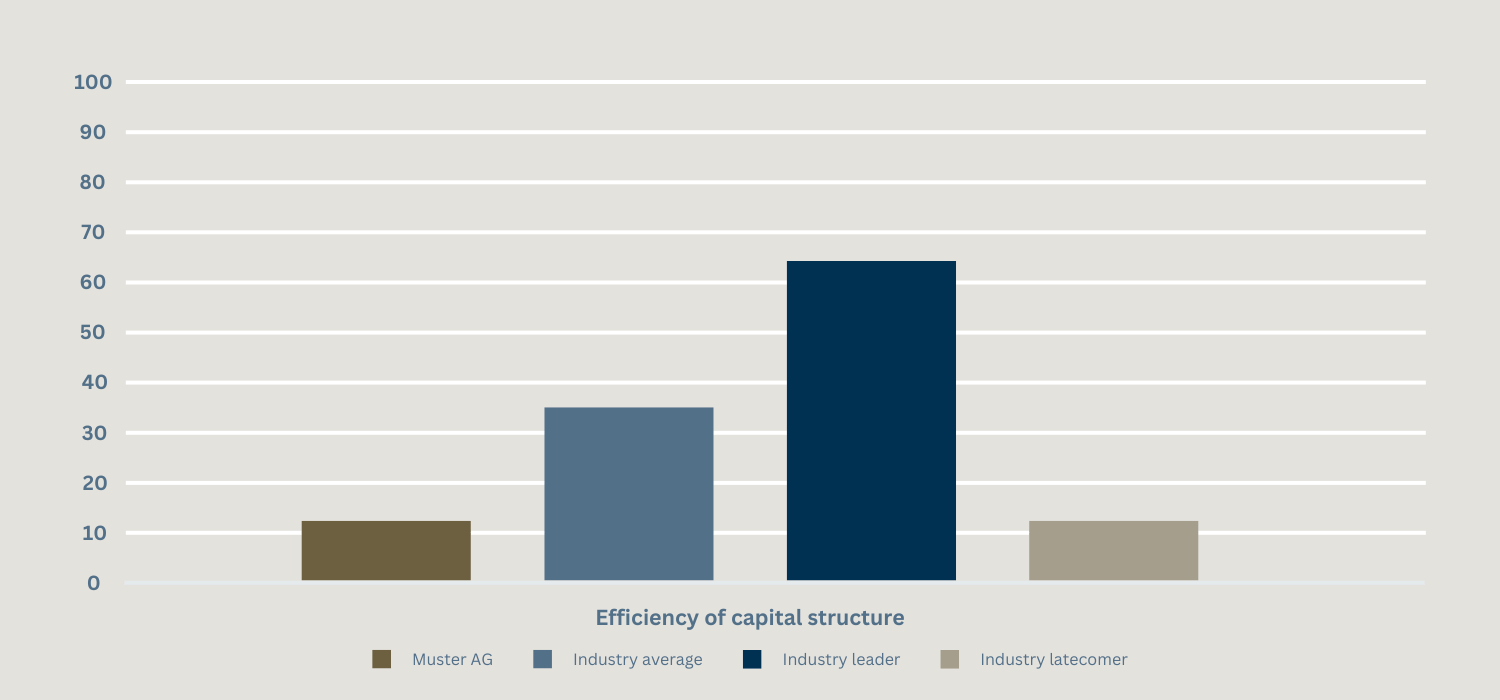
Capital structure efficiency as part of the corporate substance examines the main elements of the capital structure in relation to various fundamentals such as total capital employed, operating performance, total liabilities and total assets. The capital tax is made up of the following key figures: current and non-current liabilities, total liabilities, equity, current assets and total assets. The evaluation of Muster AG shows a company that only corresponds to 12% of the best practice profile of the global reference group in the last 12 months up to June 30, 2022. The figure shows that this result is well below the industry average.

Given is a bar chart in a coordinate system showing the efficiency of the capital structure of Muster AG compared with the rest of the industry. The x-axis is scaled from 0-70 in steps of ten. The first bar reflects Muster AG. The second bar reflects the industry average and extends to approx. 35. The third bar reflects the industry leader and extends to approx. 63. The fourth and final bar reflects the industry laggards and extends to approx. 11.
The efficiency of Muster AG’s capital structure compared with the rest of the industry.

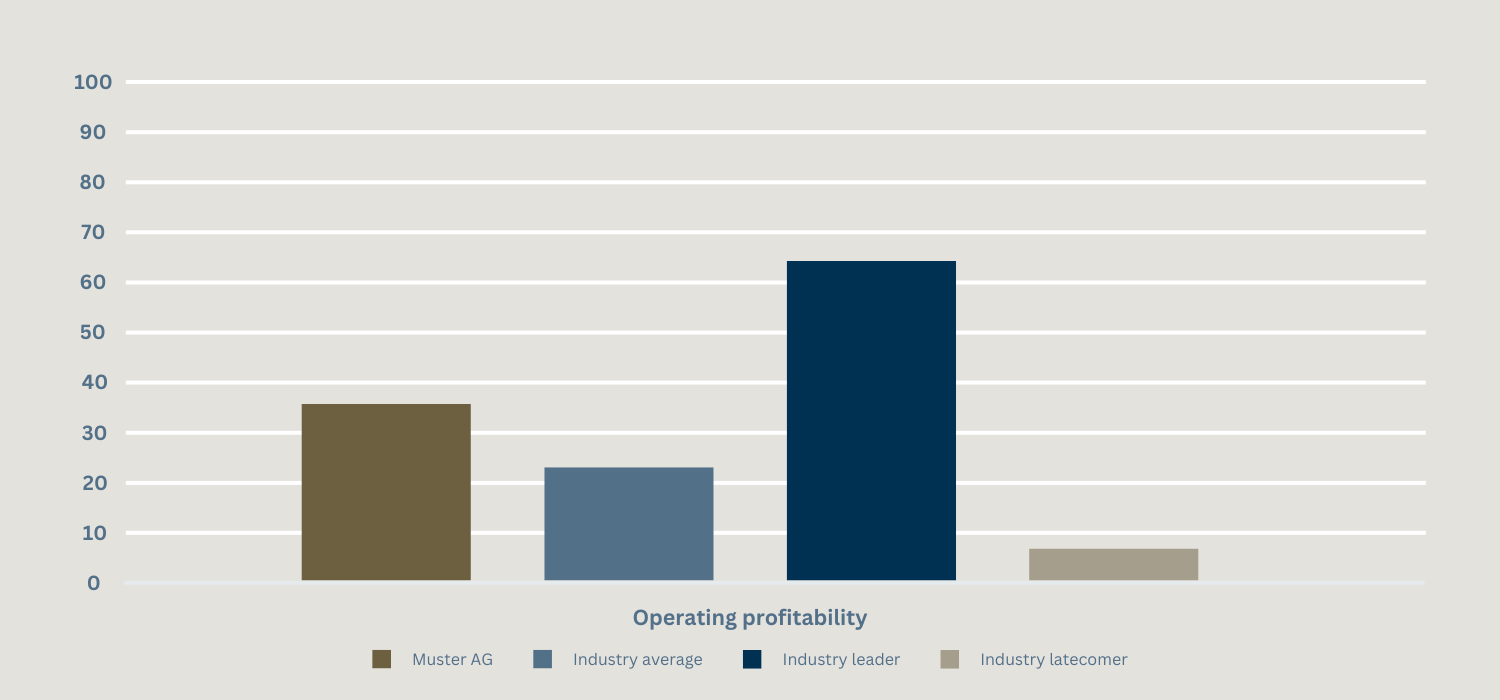
The key figures for operating profitability are better. Operating profitability provides an upstream analysis of efficiency in generating profitability and comprises gross profit, EBIT and EBITD in relation to several key denominators. These are, in particular, the capital employed, equity, total assets and operating income. Here, Muster AG is above the industry average, but still far below the performance of the industry leaders. More precisely, Muster AG has a 34% match of the best practice profile with the global reference group in the last 12 months up to June 30, 2022.

A bar chart is given in a coordinate system. The x-axis is scaled in steps of ten from 0 - 100. Again, four bars are given. The first bar reflects the model company and extends to approx. 37. The second bar reflects the industry average and extends to approx. 22. The third bar reflects the industry leaders and extends to approx. 63. The fourth and final bar reflects the industry laggards and extends to approx. 6.
The operating profitability of Muster AG in a sector comparison.

With regard to the substance of the company, we used the Financial Risk Report to identify weaknesses in the area of operating profitability and the efficiency of Muster AG’s capital structure. In the next part of our blog series, you can find out how the abnormal items in the balance sheet of Muster AG affect its FRR. All other blog posts in the series can be found below.

Further interesting postss.

05.03.2024
5 Min.
Sample report part 8: ROA analysis according to DuPont in the FRR
In this excerpt from the Financial Risk Report, we examine the return on assets (ROA) of Muster AG using the DuPont analysis.
05.03.2024
6 Min.
Sample report part 5: FRR cash flow analysis
Within the Financial Risk Report, BAMAC Group carries out numerous investigations in order to guarantee a comprehensive supplier evaluation. In this article, we present the results of the cash flow analysis of Muster AG.
05.03.2024
4 Min.
Sample report part 6: FRR liquidity analysis
This excerpt from the Financial Risk Report looks at the liquidity situation of Muster AG and puts it into context. The BAMAC GROUP's Financial Risk Report is the tried and tested tool for a comprehensive assessment of your suppliers.
05.03.2024
6 Min.
Sample report part 2: Historical FRR and analysis of performance categories
We at the BAMAC GROUP help you to assess the financial risk rating of your suppliers as well as their default risk in order to ensure a secure supply chain. In this article, we take a look back and examine the development of the financial risk rating of the Muster AG and analyze the performance categories.
05.03.2024
10 Min.
Sample report part 1: FRR Management Summary
The predictability offered by a secure supply chain is worth its weight in gold. The BAMAC GROUP's Financial Risk Report enables you to obtain this information. In this article, we will use an example report to show you what information and benefits you can gain for your company from the Financial Risk Report.
05.03.2024
8 Min.
Example report part 4: adjusted, simulated FRR – abnormal items
In this excerpt from the Financial Risk Report, the abnormal items of Muster AG are examined and put into context. The BAMAC GROUP's Financial Risk Report is the tried and tested tool for a comprehensive assessment of your suppliers.
05.03.2024
5 Min.
Supplier evaluation with the Financial Risk Report: Secure your supply chain
A secure supply chain is worth its weight in gold, as it ensures your company's long-term success. The Financial Risk Report is our tried and tested tool that makes supplier evaluation much easier for you.
05.03.2024
5 Min.
Sample report part 7: Activity relationships in the FRR
This article is dedicated to the section of the Financial Risk Report that examines the activities of Muster AG. We take a look at the key figures for receivables processing and asset utilization and show findings result from this analysis.
05.03.2024
8 Min.
Sample report part 9: The balance sheet from the perspective of the FRR
In this concluding article on the Financial Risk Report, we present the balance sheet and income statement of Muster AG and explain why a look at these financial documents also makes sense for supplier evaluation.