Sample report part 5: FRR cash flow analysis

In a nutshell

Within the Financial Risk Report, BAMAC Group carries out numerous investigations in order to guarantee a comprehensive supplier evaluation. In this article, we present the results of the cash flow analysis of Muster AG.

Cash flow analysis in the Financial Risk Report

The Financial Risk Report‘s numerous investigations, which guarantee a comprehensive supplier assessment, also include a cash flow analysis. Here we present the results for Muster AG.

Cash flow of Muster AG

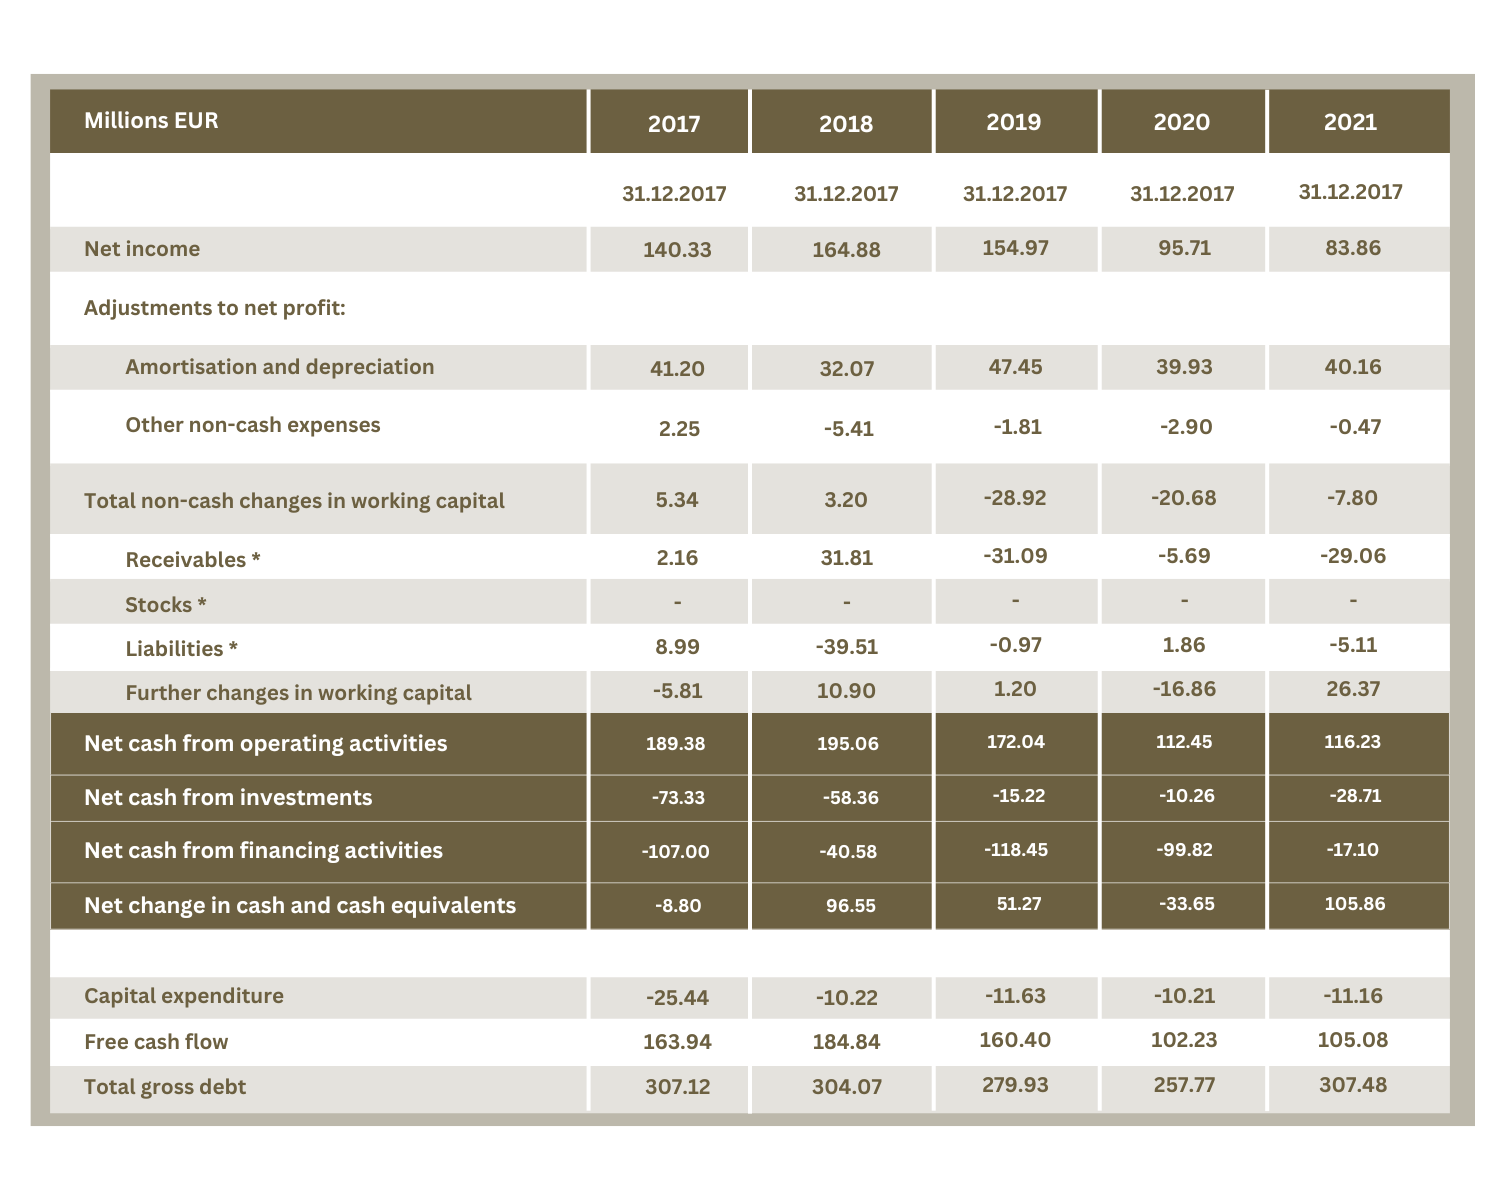
As at December 31, 2021, the analysis confirms a positive cash flow outlook for Muster AG. The company generated a positive cash flow at a good level in the last financial year. The coverage of investment expenditure by internally generated cash flow was exceptionally high at more than 400%. In addition, the free cash flow covered the debt to a high degree. It is noticeable that capital expenditure is drastically lower than depreciation in the current year, which may indicate a considerable degree of underinvestment.

The free cash flow of Muster AG

Free cash flow is the cash flow that a company can generate after considering the costs of maintaining or expanding its assets. The analysis of the free cash flow of Muster AG showed that it has been positive in the last 5 years. It ranged from a high of EUR 184.84 million in 2018 to a low of EUR 102.23 million in 2020. In the last 12 months, ending with the annual financial statements for the 2021 financial year, free cash flow rose from EUR 102.23 million to EUR 105.08 million.

A table summarising the cash flow of Muster AG from 2017 to 2021, presented in millions of euros.
Summary of the cash flow of Muster AG
* In some cases, these figures may be estimates derived from balance sheet data.

The debt burden of Muster AG

As already indicated above, it is necessary to include the debt burden if a cash flow analysis is to be carried out. For Muster AG, the debt burden rose from EUR 257.77 million in 2020 to EUR 307.48 million in 2021. Free cash flow also increased.

However, the ratio of free cash flow to total debt fell, as the increase in debt exceeded the growth in free cash flow. Nevertheless, ratios of free cash flow to debt in this order of magnitude generally indicate a solid solvency profile.

The cash flow analysis within the Financial Risk Report revealed the following:

Tabular presentation of key cash flow figures from 2019 to 2021, subdivided into three categories: ‘CFO / current liability (%)’, ‘CFO to CAPEX (x)’ and ‘Free cash flow to total debt’. The respective figures for the respective categories and years are assigned a status in the last column of the table.
Cash flow key figures

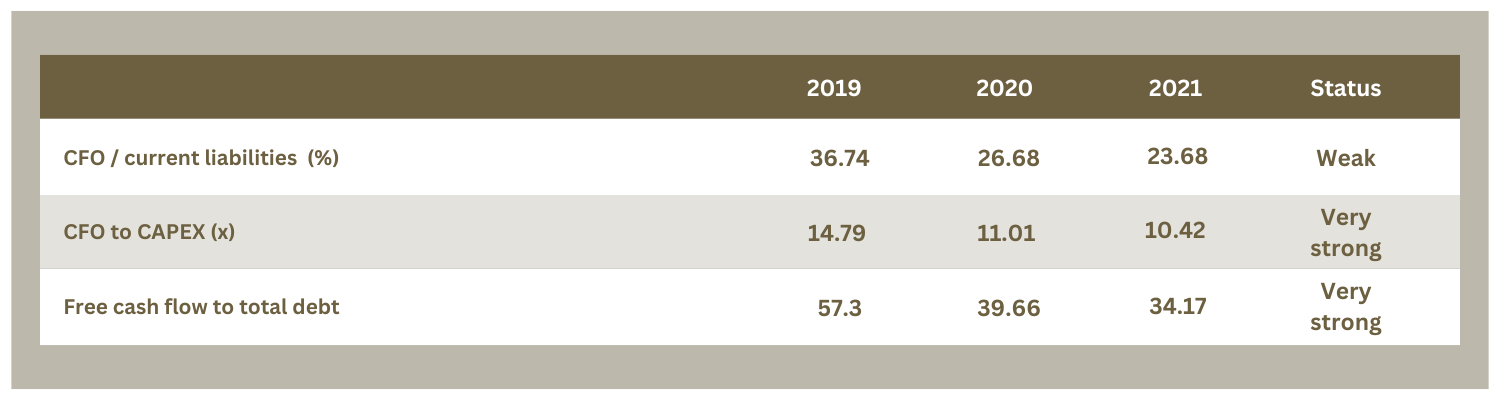
The ratio of CFO (cash flow from operating activities) to current liabilities is 23.68%. This indicates weak cash flow coverage, as the cash flow from operating activities can only cover part of the company’s current liabilities. If we compare the cash flow from operating activities (CFO) with capital expenditure (CAPEX), we obtain a ratio of 10.42 which indicates very strong cash flow coverage. The CFO is more than sufficient to cover the company’s capital expenditure. In other words, it can be concluded from this that the company is able to finance investments from the cash flow generated, which in turn indicates a solid financing basis. The ratio of free cash flow to total debt of 34.17% also means strong cash flow coverage. The specific figures can be seen in the table.

Given is a bar chart in a coordinate system that graphically depicts the values from the previous table again. The cash flow figures for the years 2019 to 2021 are shown in three different categories: ‘CFO / current liabilities (%)’, ‘CFO /CAPEX (x)’ and ‘free cash flow / total debt (%)’. On the x-axis, figures from 0 to 70 are given as a percentage in steps of ten.
Cash flow key figures

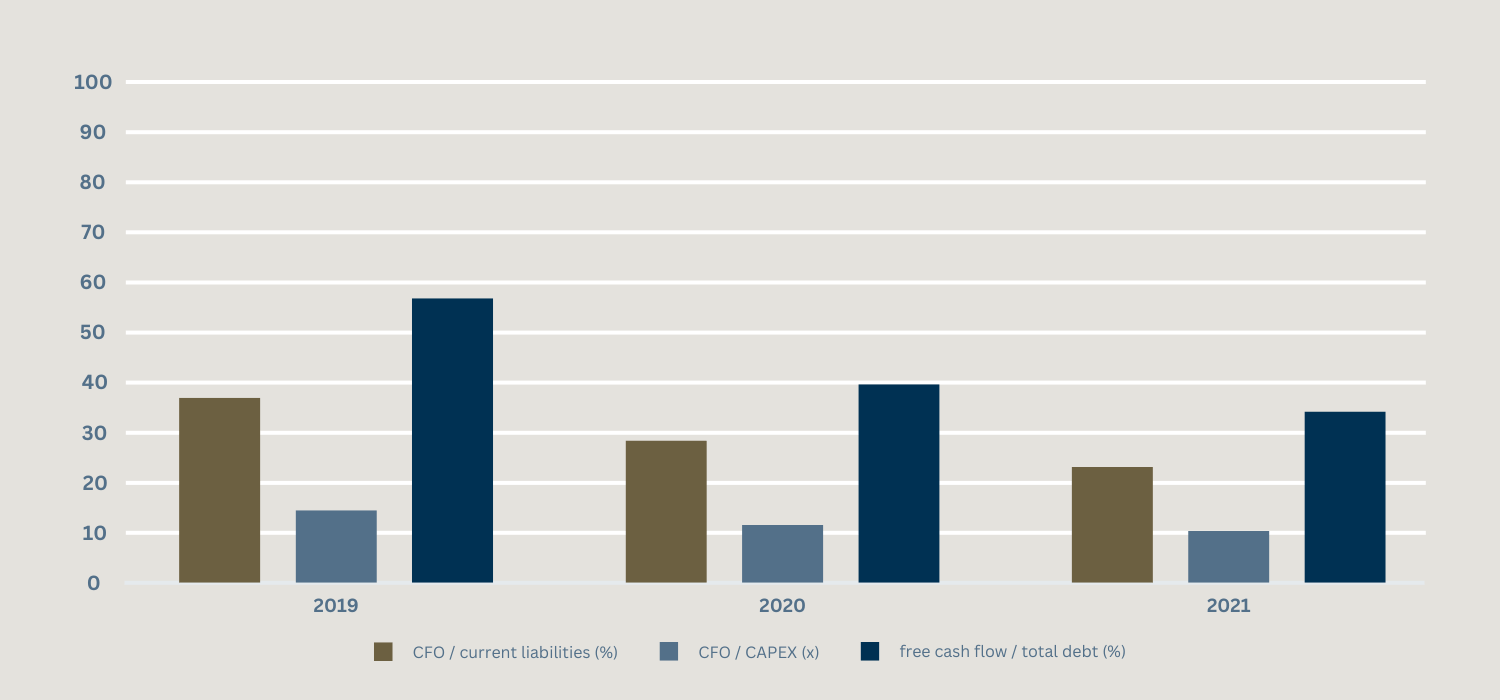
In summary, these key figures show different aspects of the company’s cash flow coverage. While the coverage of current liabilities may be weaker, the ability to cover investments and the coverage of total debt by free cash flow indicates a stronger financial position of the company. The figure above illustrates this once again.

The next part of our Financial Risk Report blog series is the liquidity analysis. A complete overview of all parts of the Financial Risk Report can be found further below.

Further interesting postss.

05.03.2024
8 Min.
Sample report part 9: The balance sheet from the perspective of the FRR
In this concluding article on the Financial Risk Report, we present the balance sheet and income statement of Muster AG and explain why a look at these financial documents also makes sense for supplier evaluation.
05.03.2024
8 Min.
Example report part 4: adjusted, simulated FRR – abnormal items
In this excerpt from the Financial Risk Report, the abnormal items of Muster AG are examined and put into context. The BAMAC GROUP's Financial Risk Report is the tried and tested tool for a comprehensive assessment of your suppliers.
05.03.2024
6 Min.
Sample report part 2: Historical FRR and analysis of performance categories
We at the BAMAC GROUP help you to assess the financial risk rating of your suppliers as well as their default risk in order to ensure a secure supply chain. In this article, we take a look back and examine the development of the financial risk rating of the Muster AG and analyze the performance categories.
05.03.2024
5 Min.
Sample report part 8: ROA analysis according to DuPont in the FRR
In this excerpt from the Financial Risk Report, we examine the return on assets (ROA) of Muster AG using the DuPont analysis.
05.03.2024
10 Min.
Sample report part 1: FRR Management Summary
The predictability offered by a secure supply chain is worth its weight in gold. The BAMAC GROUP's Financial Risk Report enables you to obtain this information. In this article, we will use an example report to show you what information and benefits you can gain for your company from the Financial Risk Report.
05.03.2024
6 Min.
Sample report part 3: FRR analysis of the company substance
BAMAC Group's Financial Risk Report is the proven tool for supplier evaluation. To give you a precise idea of the report and its benefits, we present it in detail here. This article takes a closer look at Muster AG: Current areas of strength and weakness compared to past performance are highlighted.
05.03.2024
5 Min.
Supplier evaluation with the Financial Risk Report: Secure your supply chain
A secure supply chain is worth its weight in gold, as it ensures your company's long-term success. The Financial Risk Report is our tried and tested tool that makes supplier evaluation much easier for you.
05.03.2024
5 Min.
Sample report part 7: Activity relationships in the FRR
This article is dedicated to the section of the Financial Risk Report that examines the activities of Muster AG. We take a look at the key figures for receivables processing and asset utilization and show findings result from this analysis.
05.03.2024
4 Min.
Sample report part 6: FRR liquidity analysis
This excerpt from the Financial Risk Report looks at the liquidity situation of Muster AG and puts it into context. The BAMAC GROUP's Financial Risk Report is the tried and tested tool for a comprehensive assessment of your suppliers.