Sample report part 7: Activity relationships in the FRR

In a nutshell

This article is dedicated to the section of the Financial Risk Report that examines the activities of Muster AG. We take a look at the key figures for receivables processing and asset utilization and show findings result from this analysis.

Activity relationships of Muster AG

In order to evaluate the efficiency of your suppliers’ financial management, a comprehensive view is required. We have already given you a broad overview of the Financial Risk Report (FRR), now we want to dive into the details of one part of the FRR: the employment relationships of Muster AG. We look at the key figures of Muster AG for receivables processing and asset utilization.

Analysis of employment relationships

The analysis of Muster AG’s business relationships has shown that the collection periods have increased, i.e. Muster AG has to wait longer for its customers to settle their invoices. At the time of the investigation, Muster AG had 91.62 days of receivables outstanding. The figure illustrates this development.
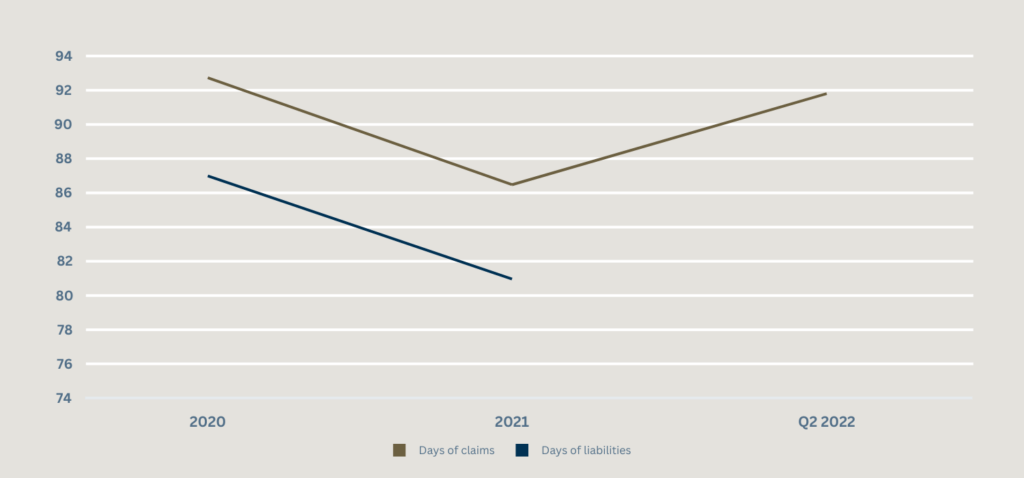
The image shows a graph with two lines representing the number of days for receivables and payables from 2020 to Q2 2022. The days of receivables start at around 93 in 2020, fall to around 86 in 2021 and rise again to around 92 by the second quarter of 2022. The days of liabilities start at around 87 in 2020 and fall to around 81 in 2021.
Employment relationships

If we look at the activity ratios for asset turnover, we see that the company has generated EUR 0.33 for every euro of assets in the last 12 months. The table shows that performance in this key figure is declining. In other words, Muster AG generated less turnover per euro of its assets last year compared to previous periods.

In contrast, both the table and the figure show that although the days of receivables are increasing, they were at an even higher level in 2020 than in the period under review.

The table shows the key figures of a company for 2020, 2021 and Q2 2022, including the development (trend). The key figures include: Days of Inventory, Days of Receivables, Days of Payables, Cash Conversion Cycle and Asset Turnover. Some of the key figures are not available (n.a.). The days of receivables developed upwards, the asset turnover downwards. The other key figures are not available or no trend is recognisable.
Employment relationships – n.a.: No data available or information not relevant

Days sales outstanding: We discuss the impact of delayed payments on the liquidity and working capital of Muster AG. The aforementioned 91.62 days of receivables outstanding at Muster AG represent a challenge. This is because a longer receivables term can adversely affect the financial position and may require adjustments to payment processing.

Asset turnover and efficiency: Here we look at how a falling asset turnover indicates that the company may be becoming more inefficient. This may indicate operational challenges or inefficient use of capital. The fact that Muster AG generates only EUR 0.33 in sales per euro of assets illustrates its declining efficiency.

Optimization of receivables processing: We suggest possible measures to shorten receivables processing times, as well as improved receivables management and clearer payment terms to reduce the number of days in arrears.

Increasing the efficiency of asset turnover: Various strategies can be discussed here to improve asset utilization, such as investing in more efficient operations or reviewing asset allocations.

As shown, the activity ratios for key figures such as days sales outstanding and asset turnover also provide important information on the financial health and efficiency of a company. This example shows that Muster AG could improve its performance and ensure long-term success through targeted measures.

For Part 8 of the exemplary Financial Risk Report, in which we examine the return on the invested assets of Muster AG. Find all other parts of the FRR below this post.

Further interesting postss.

05.03.2024
5 Min.
Supplier evaluation with the Financial Risk Report: Secure your supply chain
A secure supply chain is worth its weight in gold, as it ensures your company's long-term success. The Financial Risk Report is our tried and tested tool that makes supplier evaluation much easier for you.
05.03.2024
9 Min.
Sample report part 9: The balance sheet from the perspective of the FRR
In this concluding article on the Financial Risk Report, we present the balance sheet and income statement of Muster AG and explain why a look at these financial documents also makes sense for supplier evaluation.
05.03.2024
10 Min.
Sample report part 1: FRR Management Summary
The predictability offered by a secure supply chain is worth its weight in gold. The BAMAC GROUP's Financial Risk Report enables you to obtain this information. In this article, we will use an example report to show you what information and benefits you can gain for your company from the Financial Risk Report.
05.03.2024
4 Min.
Sample report part 6: FRR liquidity analysis
This excerpt from the Financial Risk Report looks at the liquidity situation of Muster AG and puts it into context. The BAMAC GROUP's Financial Risk Report is the tried and tested tool for a comprehensive assessment of your suppliers.
05.03.2024
6 Min.
Sample report part 3: FRR analysis of the company substance
BAMAC Group's Financial Risk Report is the proven tool for supplier evaluation. To give you a precise idea of the report and its benefits, we present it in detail here. This article takes a closer look at Muster AG: Current areas of strength and weakness compared to past performance are highlighted.
05.03.2024
6 Min.
Sample report part 2: Historical FRR and analysis of performance categories
We at the BAMAC GROUP help you to assess the financial risk rating of your suppliers as well as their default risk in order to ensure a secure supply chain. In this article, we take a look back and examine the development of the financial risk rating of the Muster AG and analyze the performance categories.
05.03.2024
5 Min.
Sample report part 8: ROA analysis according to DuPont in the FRR
In this excerpt from the Financial Risk Report, we examine the return on assets (ROA) of Muster AG using the DuPont analysis.
05.03.2024
6 Min.
Sample report part 5: FRR cash flow analysis
Within the Financial Risk Report, BAMAC Group carries out numerous investigations in order to guarantee a comprehensive supplier evaluation. In this article, we present the results of the cash flow analysis of Muster AG.
05.03.2024
8 Min.
Example report part 4: adjusted, simulated FRR – abnormal items
In this excerpt from the Financial Risk Report, the abnormal items of Muster AG are examined and put into context. The BAMAC GROUP's Financial Risk Report is the tried and tested tool for a comprehensive assessment of your suppliers.