Sample report part 9: The balance sheet from the perspective of the FRR
In this concluding article on the Financial Risk Report, we present the balance sheet and income statement of Muster AG and explain why a look at these financial documents also makes sense for supplier evaluation.
To complete the picture that the Financial Risk Report paints of your supplier, let’s now take a look at the balance sheet figures and the income statement of Muster AG.
For a comprehensive risk assessment, as the Financial Risk Report does, a company’s balance sheet provides essential information about its financial health and stability. In the following, we first list some of the reasons for this before going into more detail on the key figures of Muster AG.
Reasons for a balance sheet analysis in the FRR
A company’s balance sheet provides information on the following key figures:
Liquidity: The balance sheet provides information on the company’s liquidity, in particular through key figures such as the current share. Low liquidity may indicate that the company may have difficulty meeting short-term obligations, which could pose a financial risk.
Debt: The level of a company’s debt is also one of the relevant balance sheet ratios. A high level of debt in relation to equity can indicate an increased risk, particularly if the company has difficulties servicing its debts.
Equity base: A company’s equity is an important indicator of its financial stability. Adequate equity can reduce the risk, as it gives the company more leeway in the event of unforeseen financial burdens.
Operating results: The income statement, which is often considered together with the balance sheet figures, provides information on the company’s operating results. Fluctuating or negative profits can indicate operational risks.
Value adjustments: The balance sheet contains information on value adjustments and write-downs on assets. A high need for value adjustments can indicate a possible overvaluation of assets and thus impairment risks.
Cash flow: The cash flow statement, which is also often analyzed together with the balance sheet, provides information about the company’s cash flow. A stable and positive cash flow is crucial in order to service long-term liabilities and make investments.
Provisions: Information on provisions in the balance sheet can provide information on possible future obligations. High provisions can indicate risks in relation to future costs.
In summary, analyzing balance sheet ratios enables a comprehensive assessment of a company’s financial health, allowing potential risks to be better identified and evaluated. This is crucial for investors, lenders and others who have an interest in the long-term success of the company.
Key balance sheet figures of Muster AG
Before we provide you with the balance sheet of Muster AG as an illustration, we will take a closer look at some of the key balance sheet figures mentioned above. Due to the fact that only figures from the first and second quarters are available for 2022, these are not taken into account in the following calculations, as they can only indicate trends.
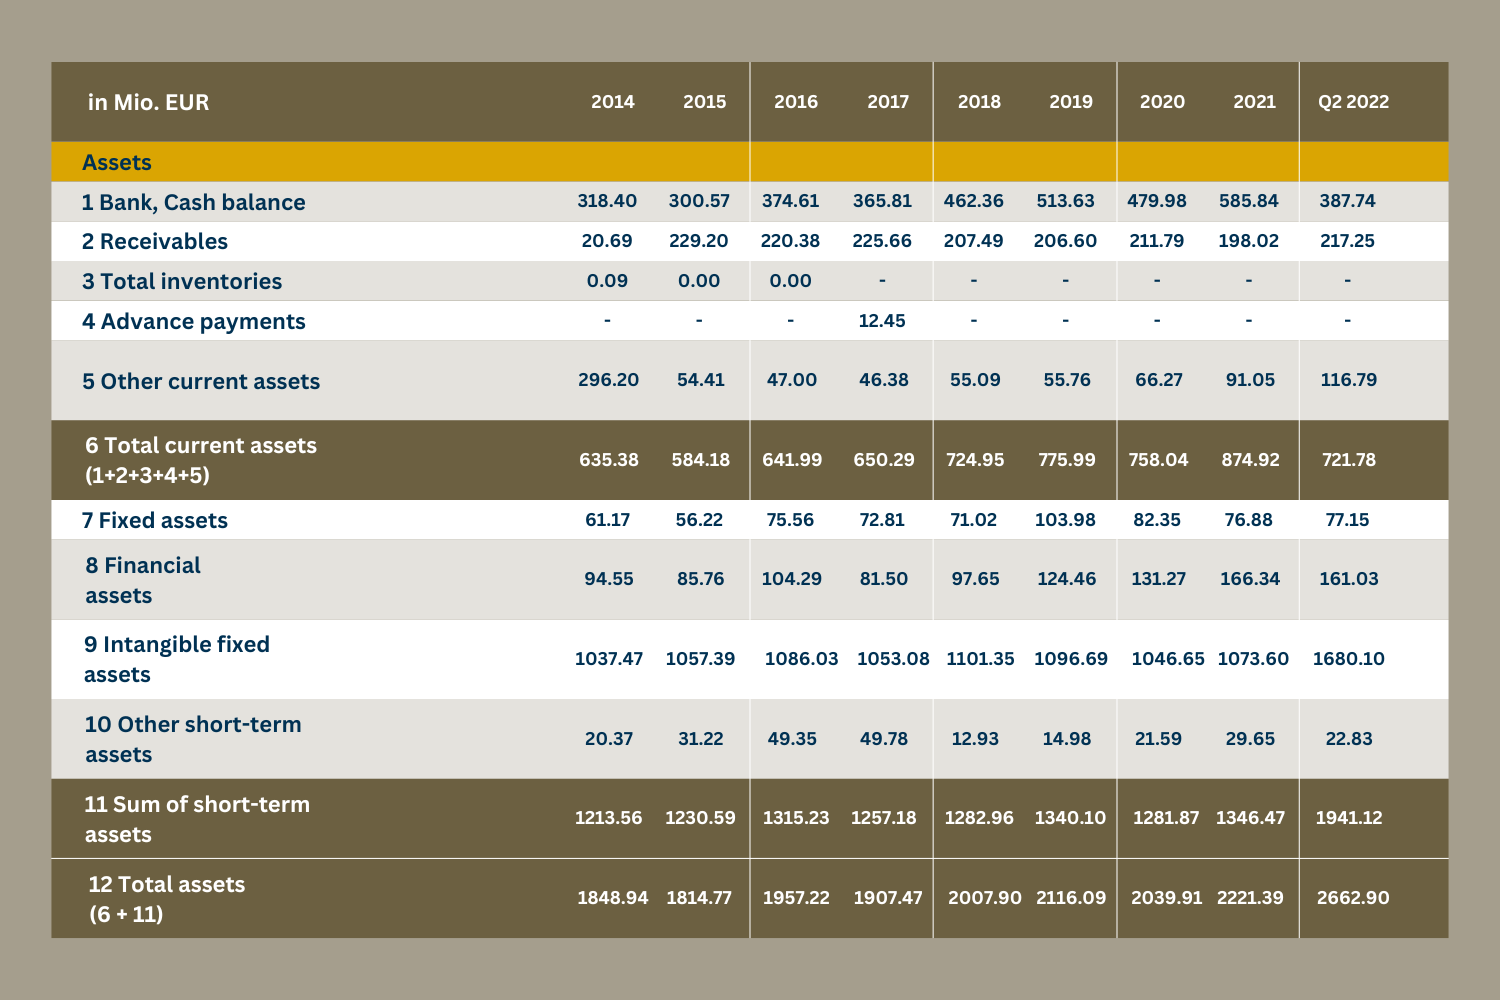
Muster AG’s liquidity has risen continuously since 2016, from EUR 374.61 million in 2016 to EUR 513.63 million in 2019. In the following year, there was a slump of EUR 33.65 million, which was offset in 2021. At EUR 585.84 million, Muster AG’s bank and cash balances even increased by EUR 72.21 million compared to 2019.
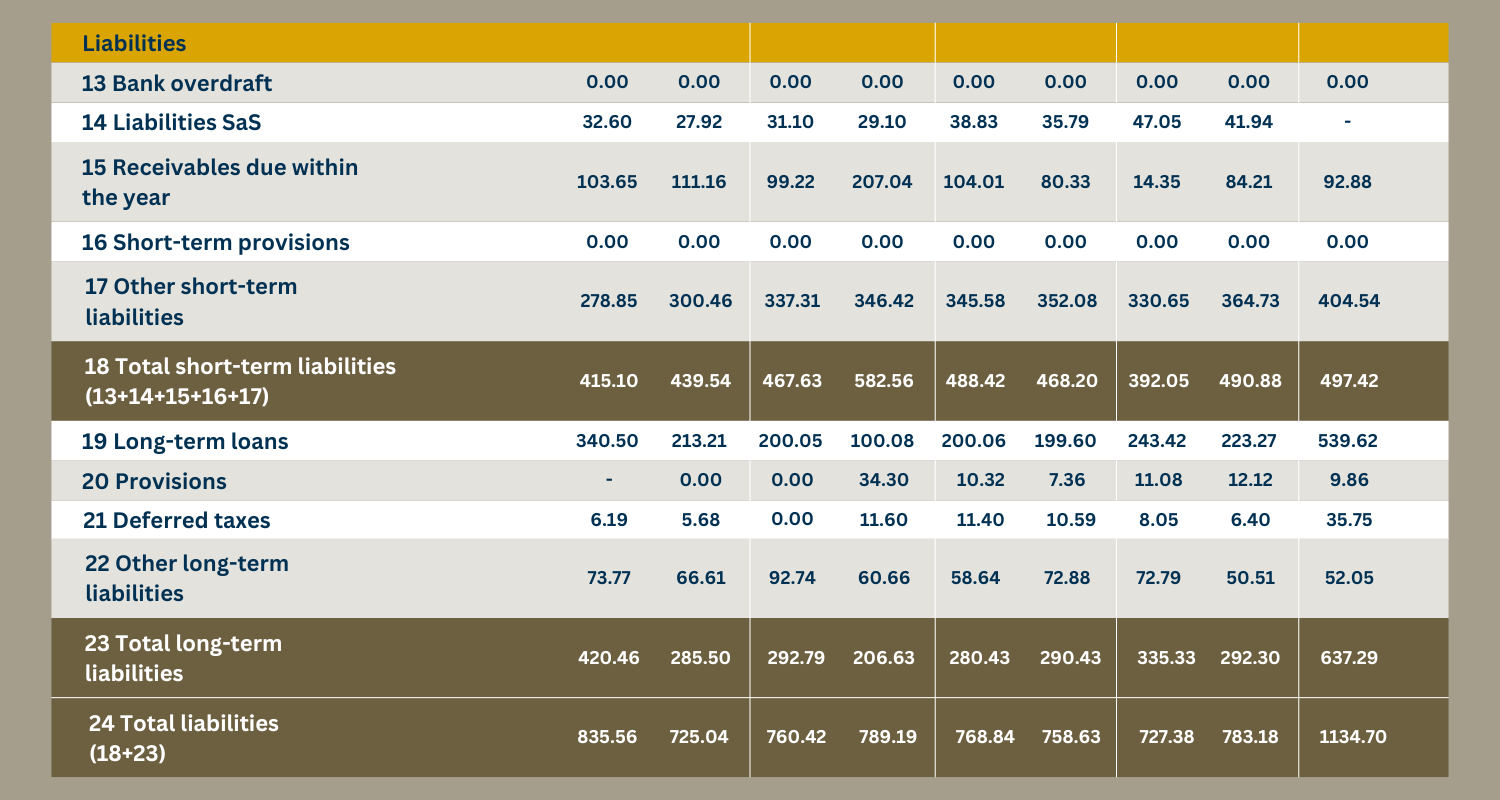
We first distinguish between current and non-current liabilities in order to assess the balance sheet ratios for the level of debt of Muster AG. Total current liabilities have remained relatively stable between EUR 470 million and EUR 490 million in recent years, following a brief peak of EUR 583.56 million in 2017 and a low of EUR 392.05 million in 2020.
Total non-current liabilities also remained stable at an average level of EUR 234.58 million. In the O2/2022 period under review, non-current liabilities increased to EU 637.29 million. This may indicate extensive investments.
Based on the specific figures for 2021, a gearing ratio of 35.26% can be calculated. This means that Muster AG has a debt ratio in the moderate range. For the second quarter of 2022, however, the gearing ratio rises to 42.61%. This can also be described as moderate.
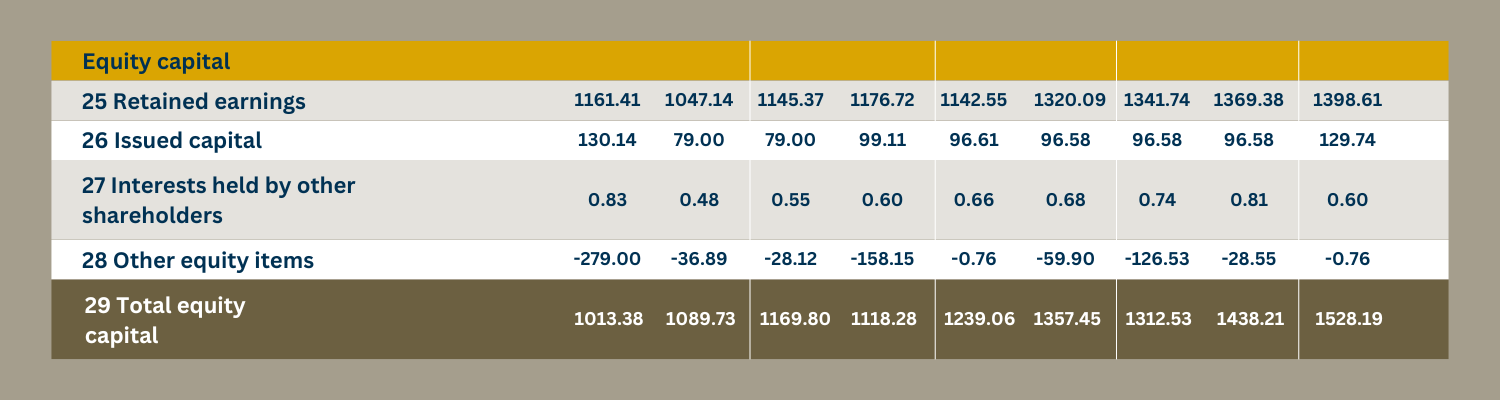
Muster AG has an equity ratio of 64.74%, which indicates that a larger proportion of assets are financed by equity, which generally indicates a more stable financial basis.
The following chart shows the exact key figures for Muster AG.
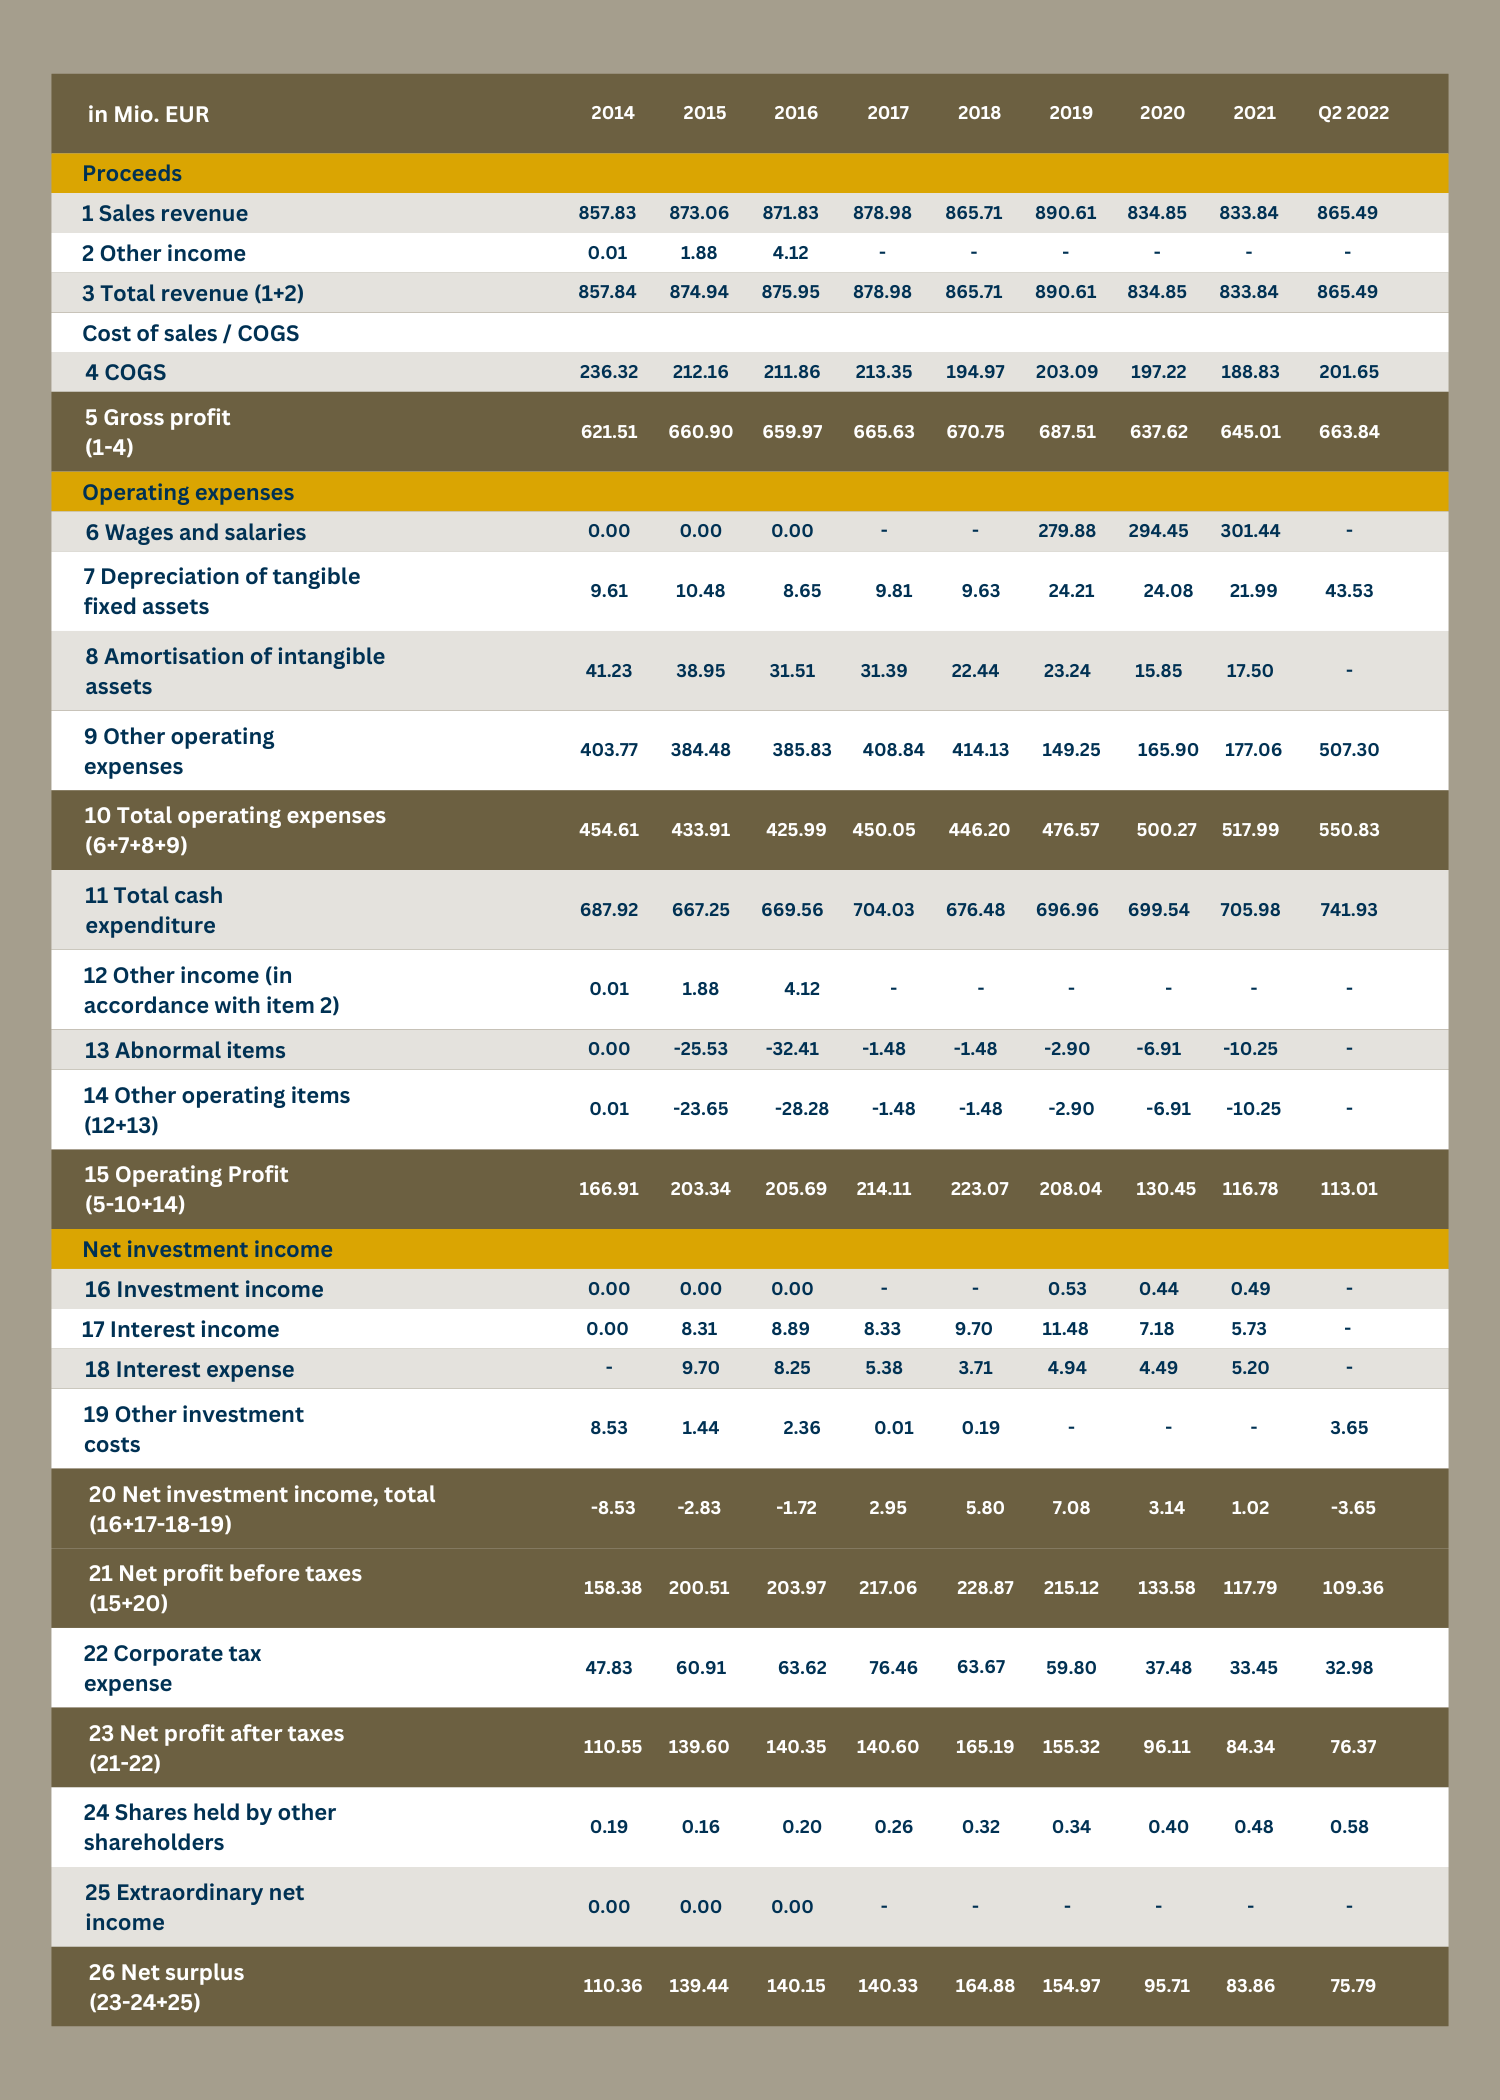
The income statement as part of the balance sheet shows that gross profit fell significantly in 2020 from EUR 687.51 million to EUR 637.62 million. Gross profit rose again in 2021 and is also showing growth for the first two quarters of 2022. At the same time, operating expenses have risen continuously. From EUR 476.57 million in 2019 to EUR 517.99 million in 2021. Further balance sheet figures can be found in the income statement of Muster AG below.
Of course, there are a number of other key balance sheet figures that can be used to draw conclusions about the financial health of the company. We have already analyzed the cash flow in our blog series about the Financial Risk Report. The other parts, in which we analyze the company’s substance, for example, and go into detail about the business relationships and much more, can be found below this blog post.
If you have any questions about the Financial Risk Report or if you want to talk about current challenges in your risk management, you can contact us at any time.
Categories of this post
Further interesting posts.


About the author
